 User Interface
Kestra comes with a rich web user interface located by default on port 8080. If you followed the Quickstart guide, the UI will be available on http://localhost:8080.
When you first navigate to the Kestra UI, you will see the Welcome page.
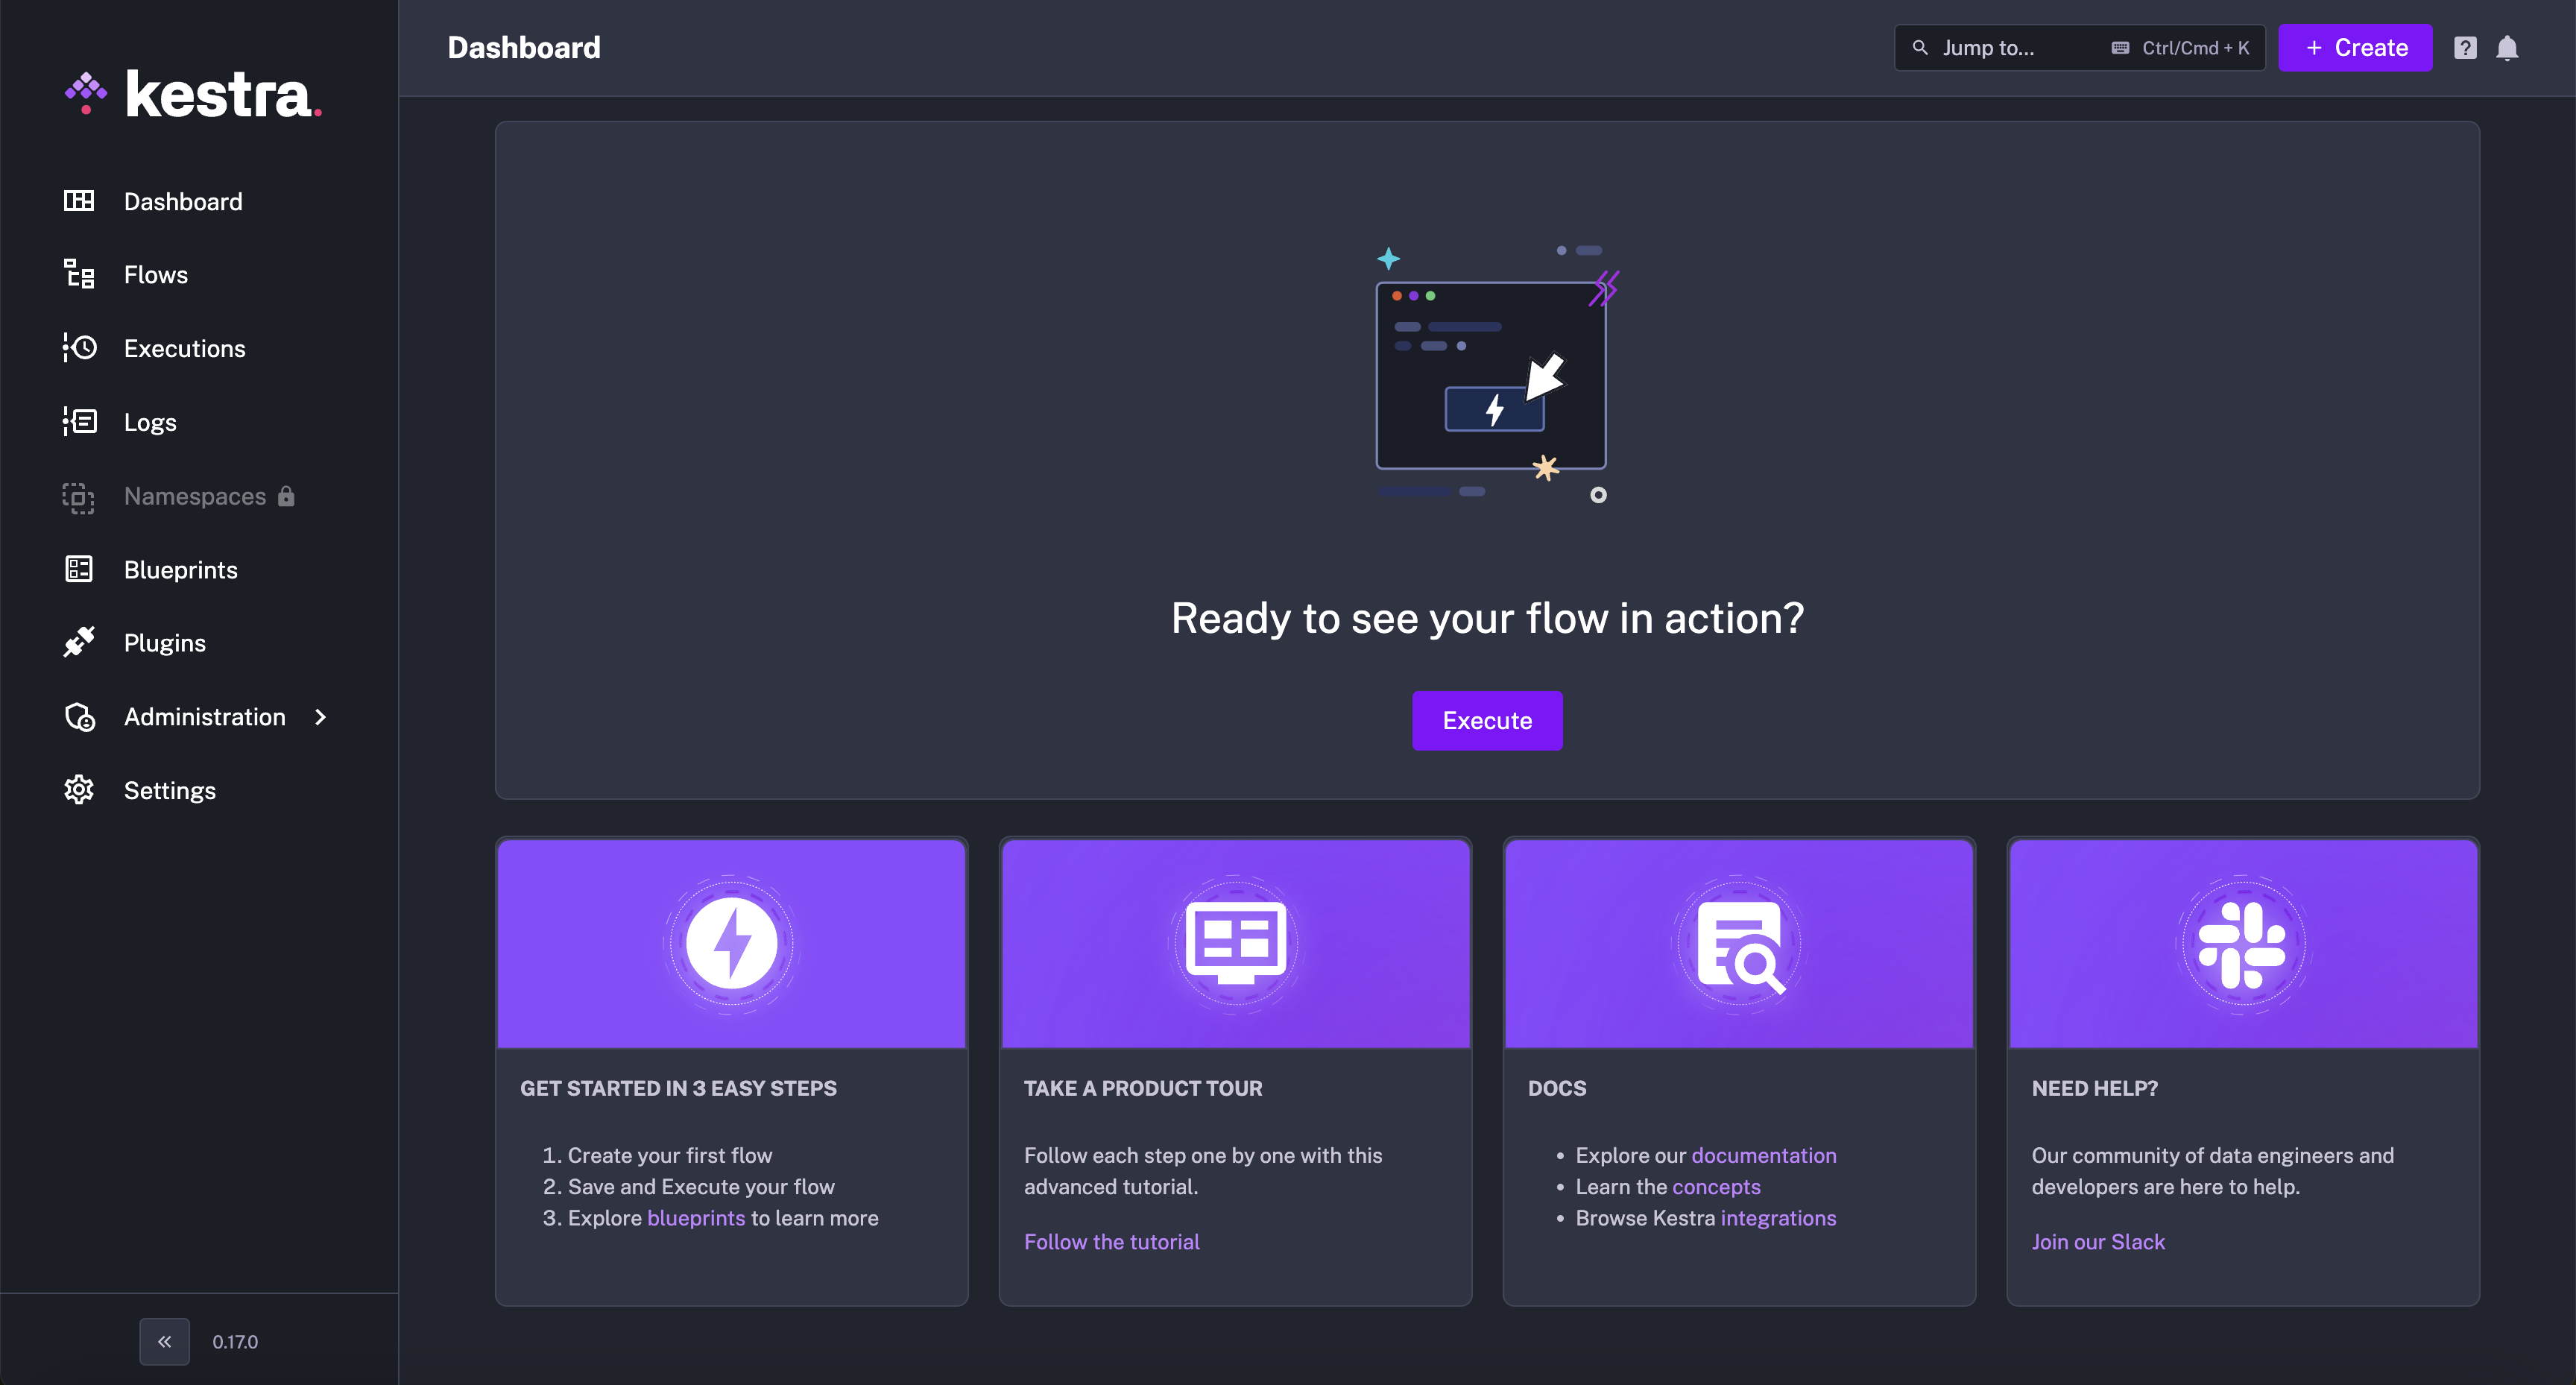
On this page, you can click on Create my first flow to open the Kestra Guided Tour which will guide you step by step through creating and executing your first flow.
On the left menu, you will see the following UI pages:
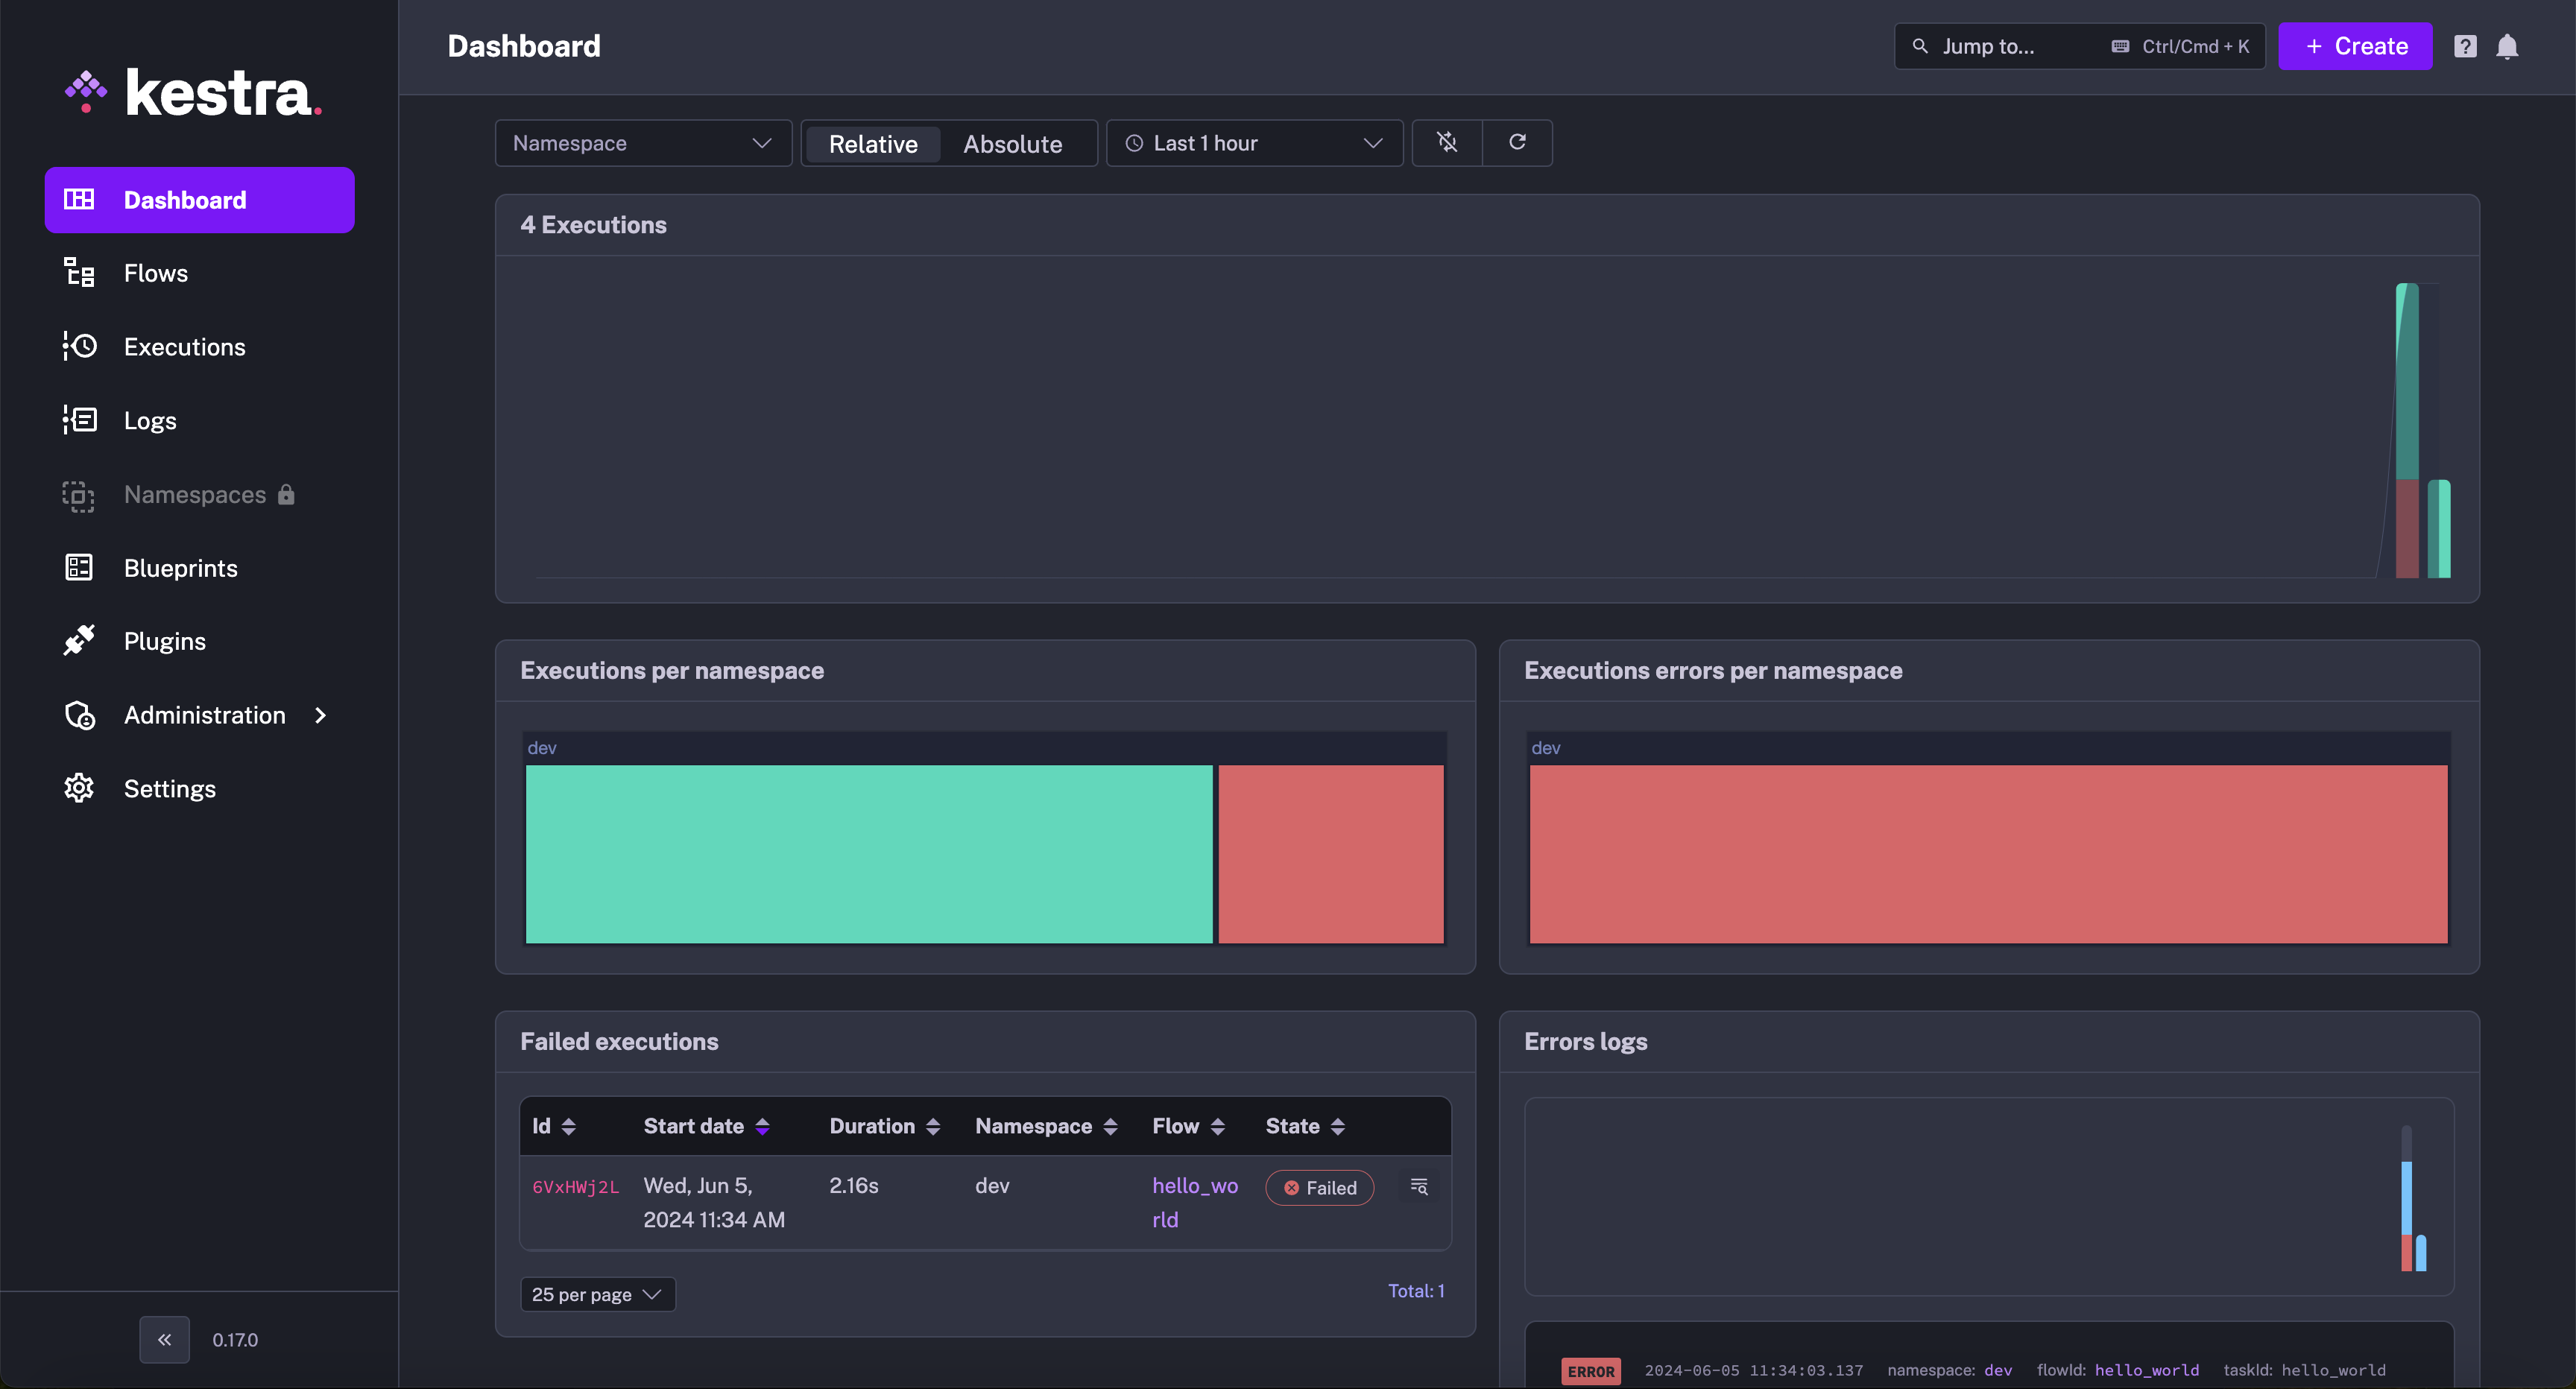
- The Home page contains a dashboard of flow executions.
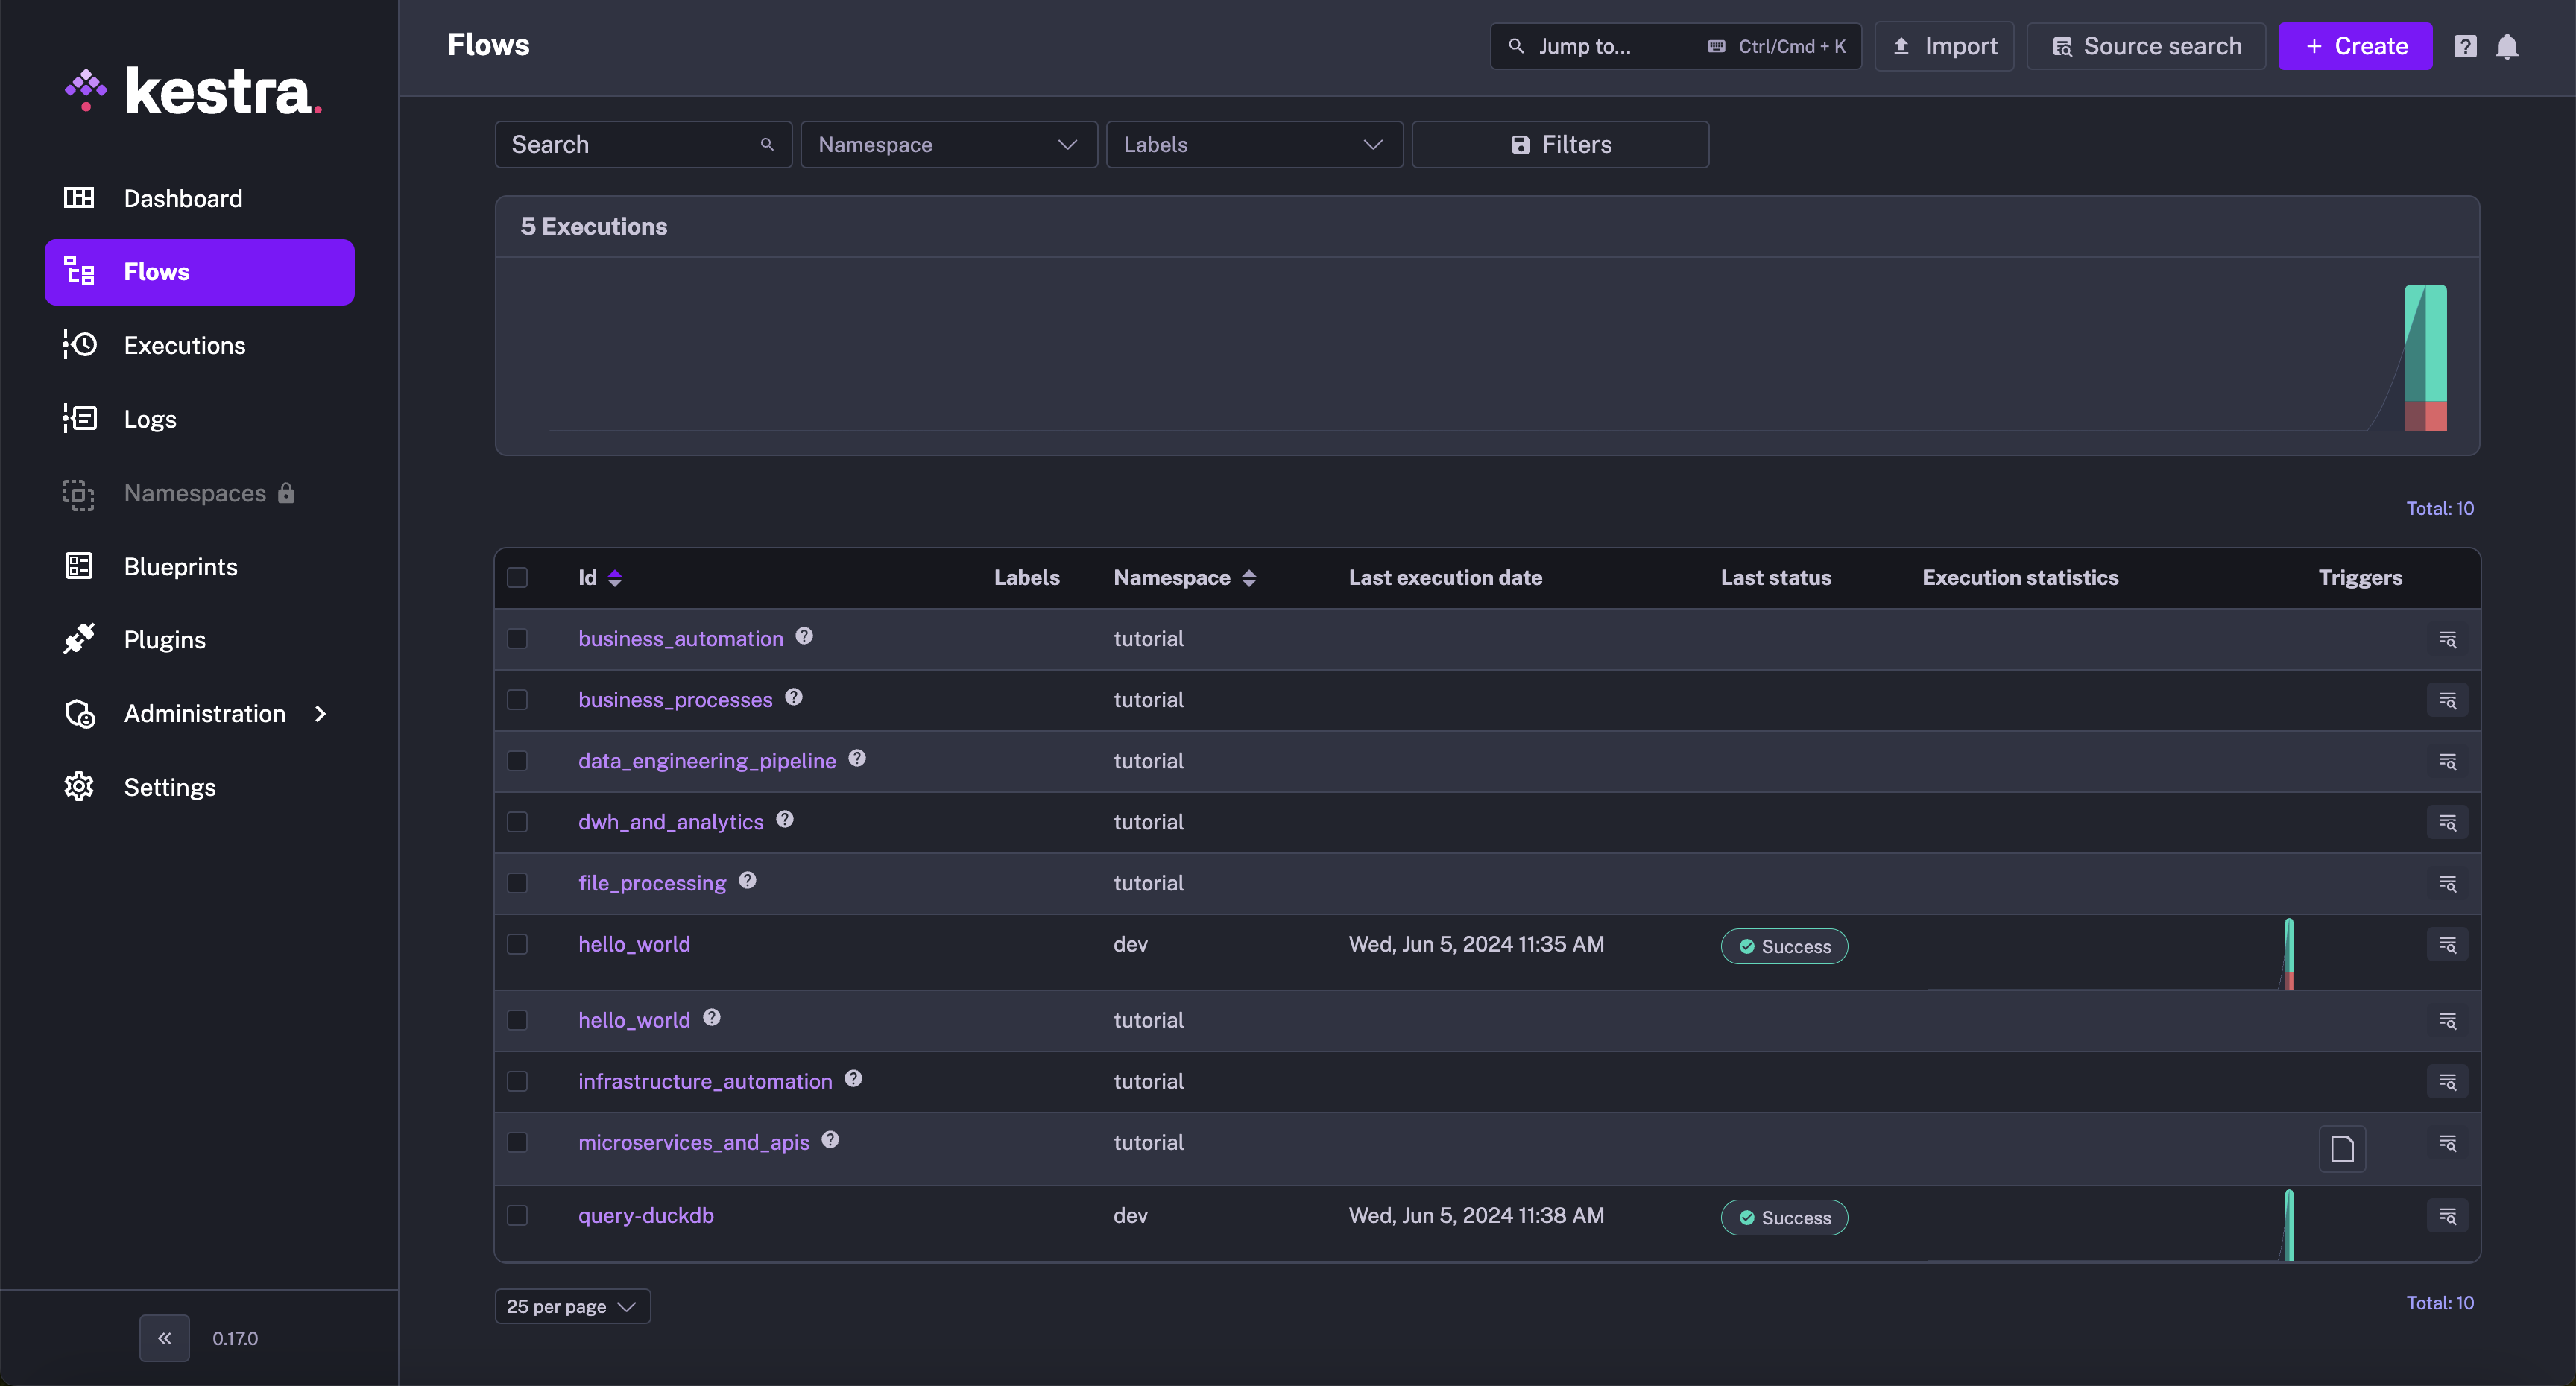
- The Flows page shows you all of your flows, allowing you to create, edit and execute them.
- The Executions page allows you to view and manage previous executions.
- The Logs page allows access to all task logs from previous executions.
- The Blueprints page provides a catalog of ready-to-use flow examples.
- The Plugins page provides a catalog of plugins you can use inside of your flows.
- The Administration page helps troubleshoot administrative issues, such as worker status, triggers, and depending on your Kestra edition, also features such as audit logs, and user management.
- The Settings page allows you to configure the Kestra UI.
The Kestra Enterprise Edition comes with additional functionalities provided by the Kestra UI:
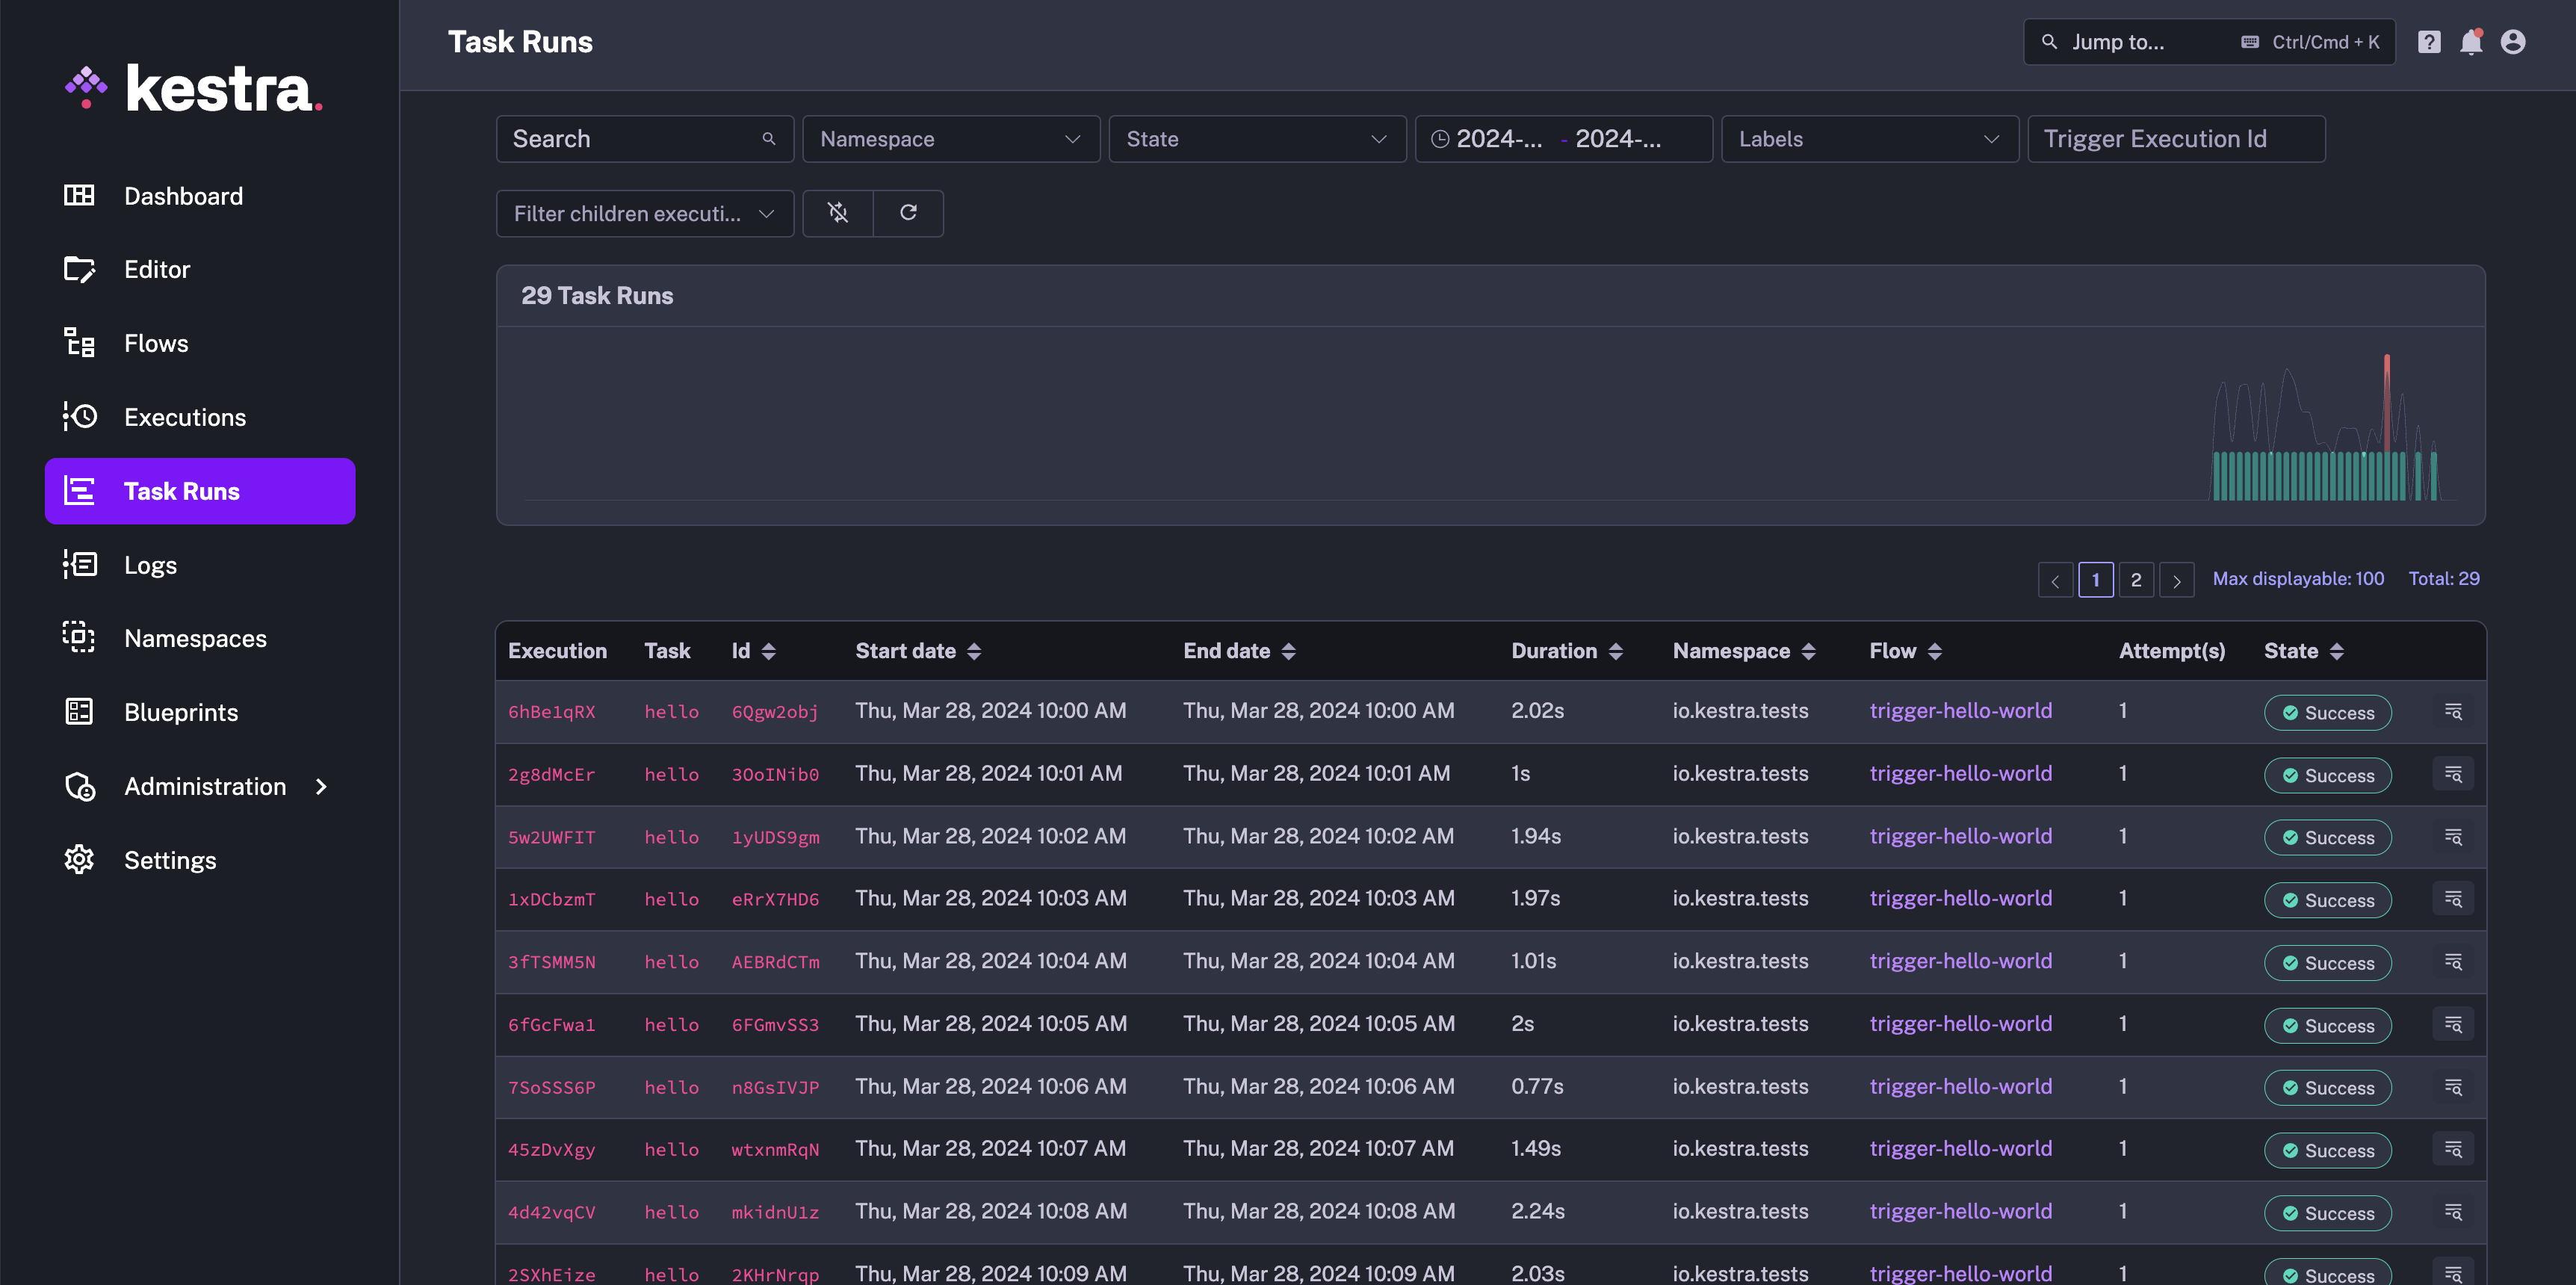
- The Task Runs page contains a dashboard of task runs, providing a full-text search engine to search for specific task run logs.
- The Namespace page allows setting specific configurations at the namespace level and enforcing authentication and role-based access control per namespace.
- The Users page allows the management of Kestra users.
- The Groups page allows the management of Kestra user groups.
- The Roles page allows the management of Kestra user roles.
- The Audit Logs page allows access to Kestra audit logs.
- The Tenants page lets you manage your tenants (page accessible only by users with admin permissions).
- The Custom Blueprints page allows you to add custom flow examples that you can reuse code and share best practices in your team.
Dashboard
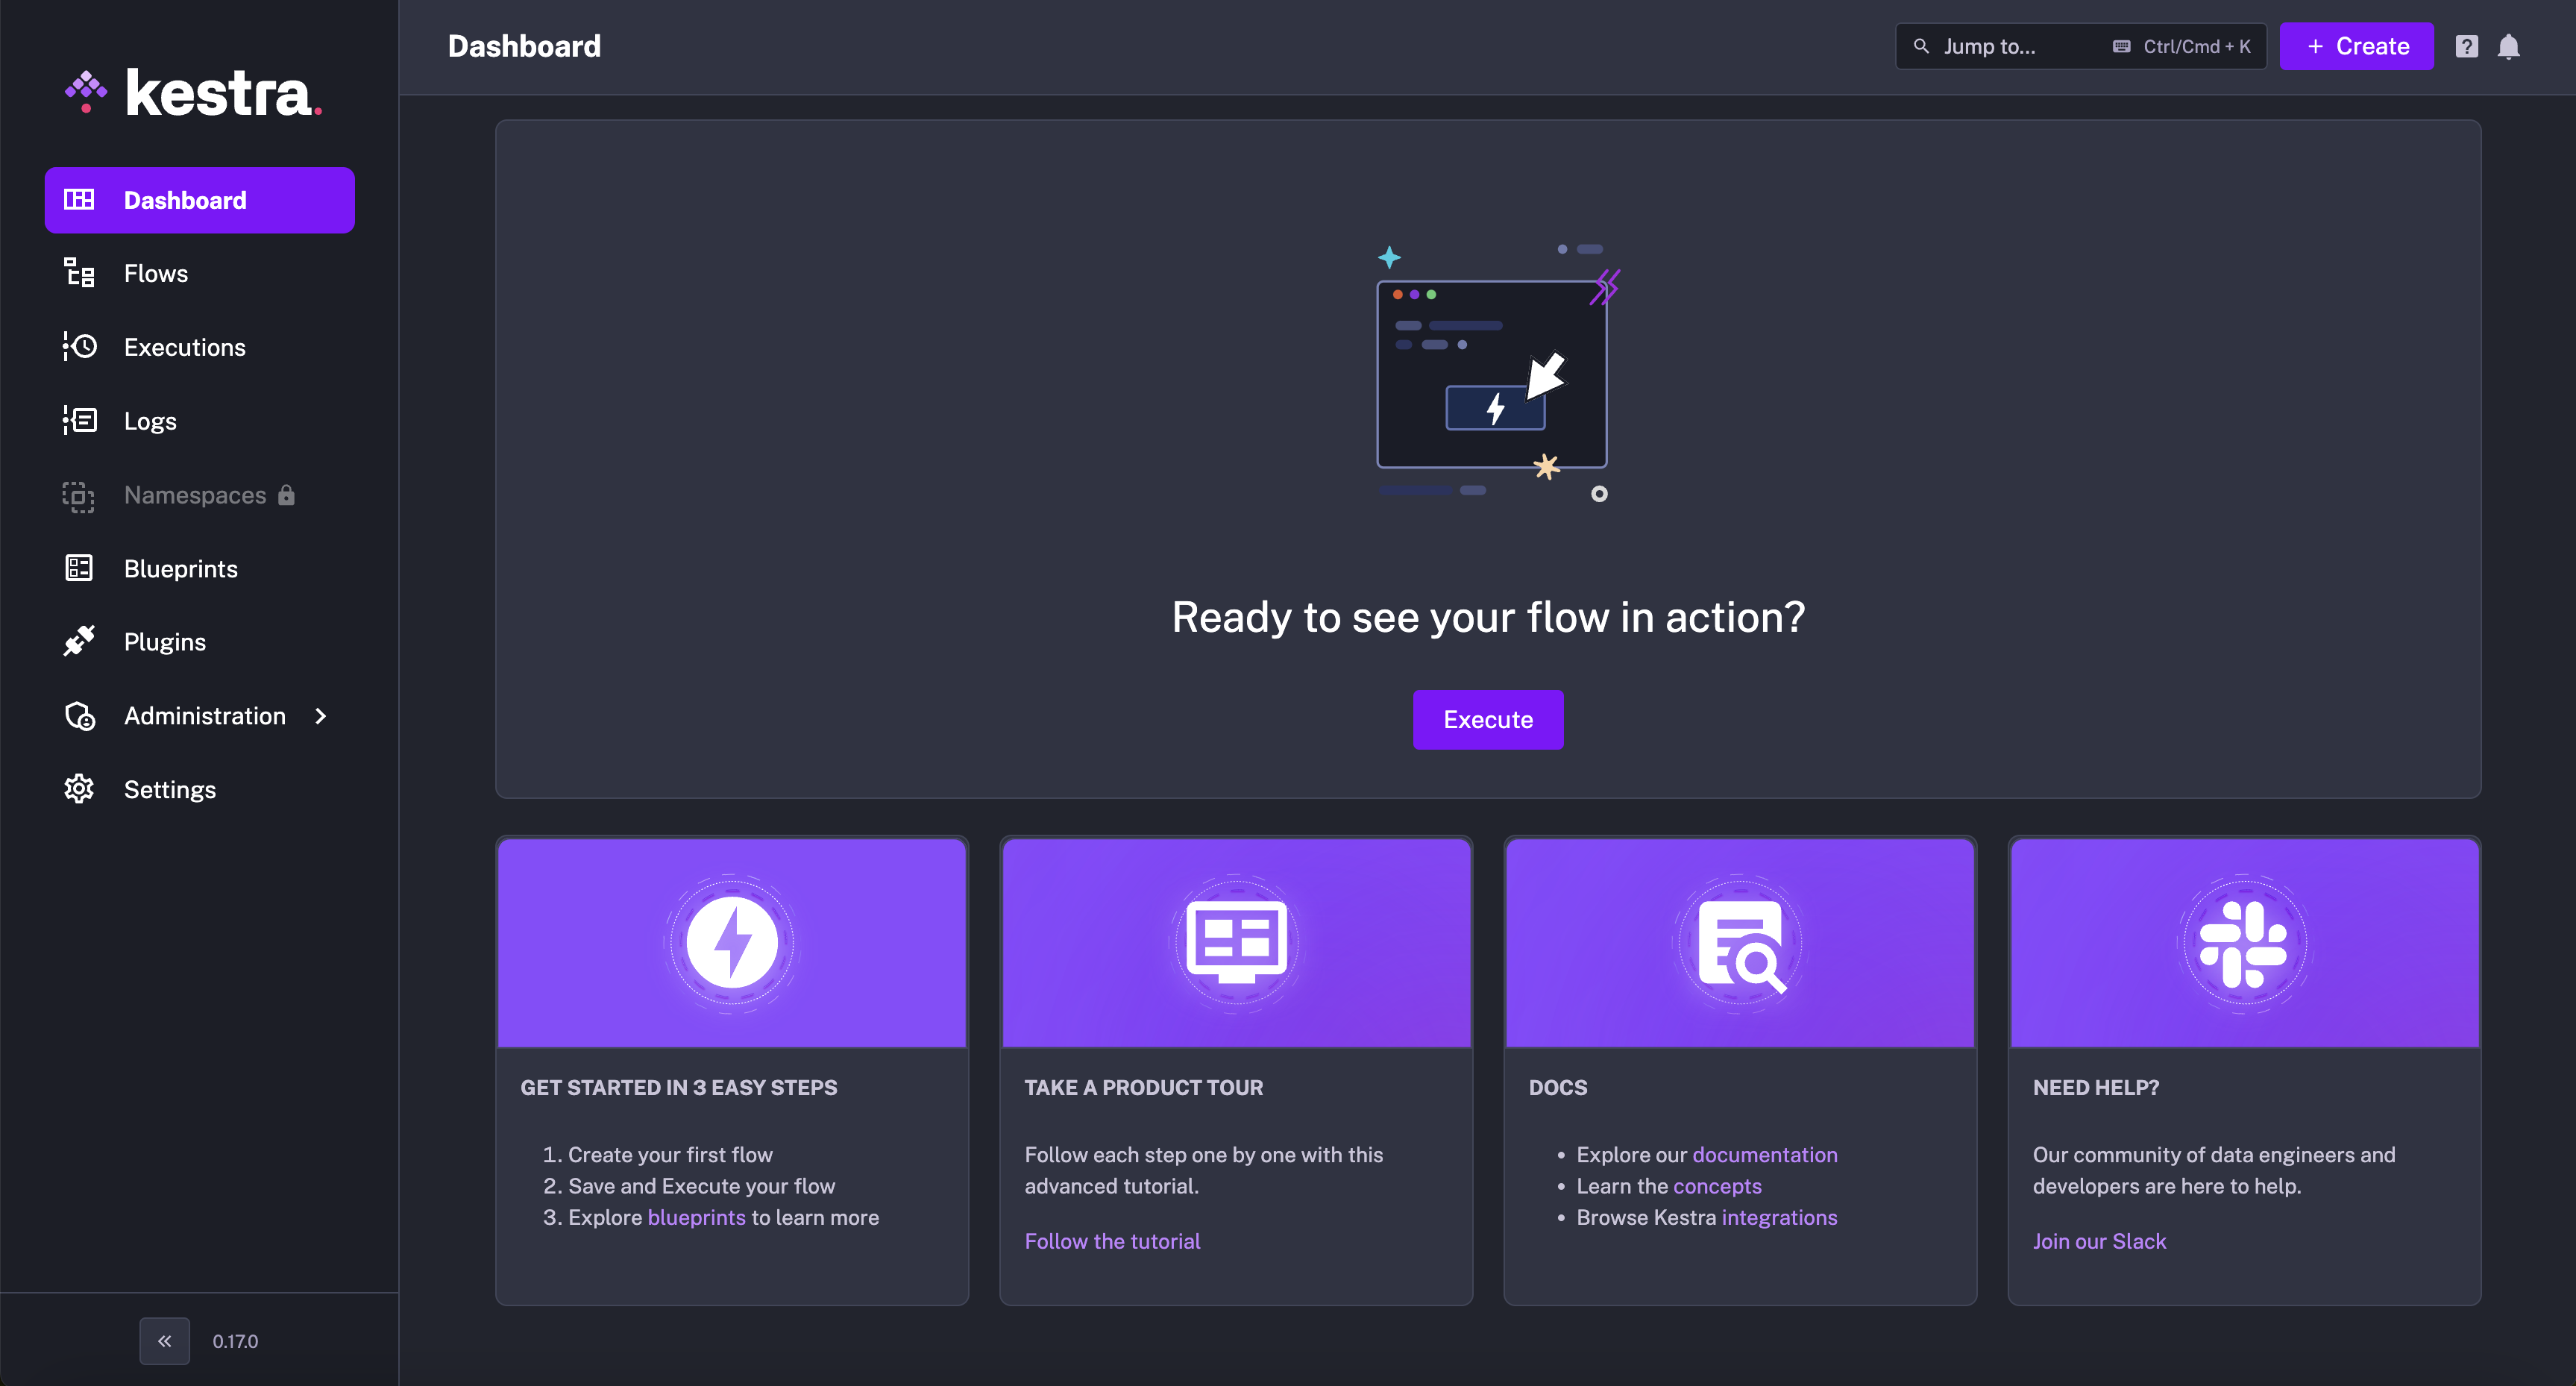
The first time you access the main Dashboard, the page will be similar to the Welcome Page as you can click Create my first flow to open the Kestra Guided Tour.
Once you have executed a flow, you will see your flow executions in the dashboard.
Flows
On the Flows page, you will see a list of flows which you can edit and execute. You can also create a new flow in the top right hand corner.
By clicking on a flow id or on the eye icon, you can open a flow.
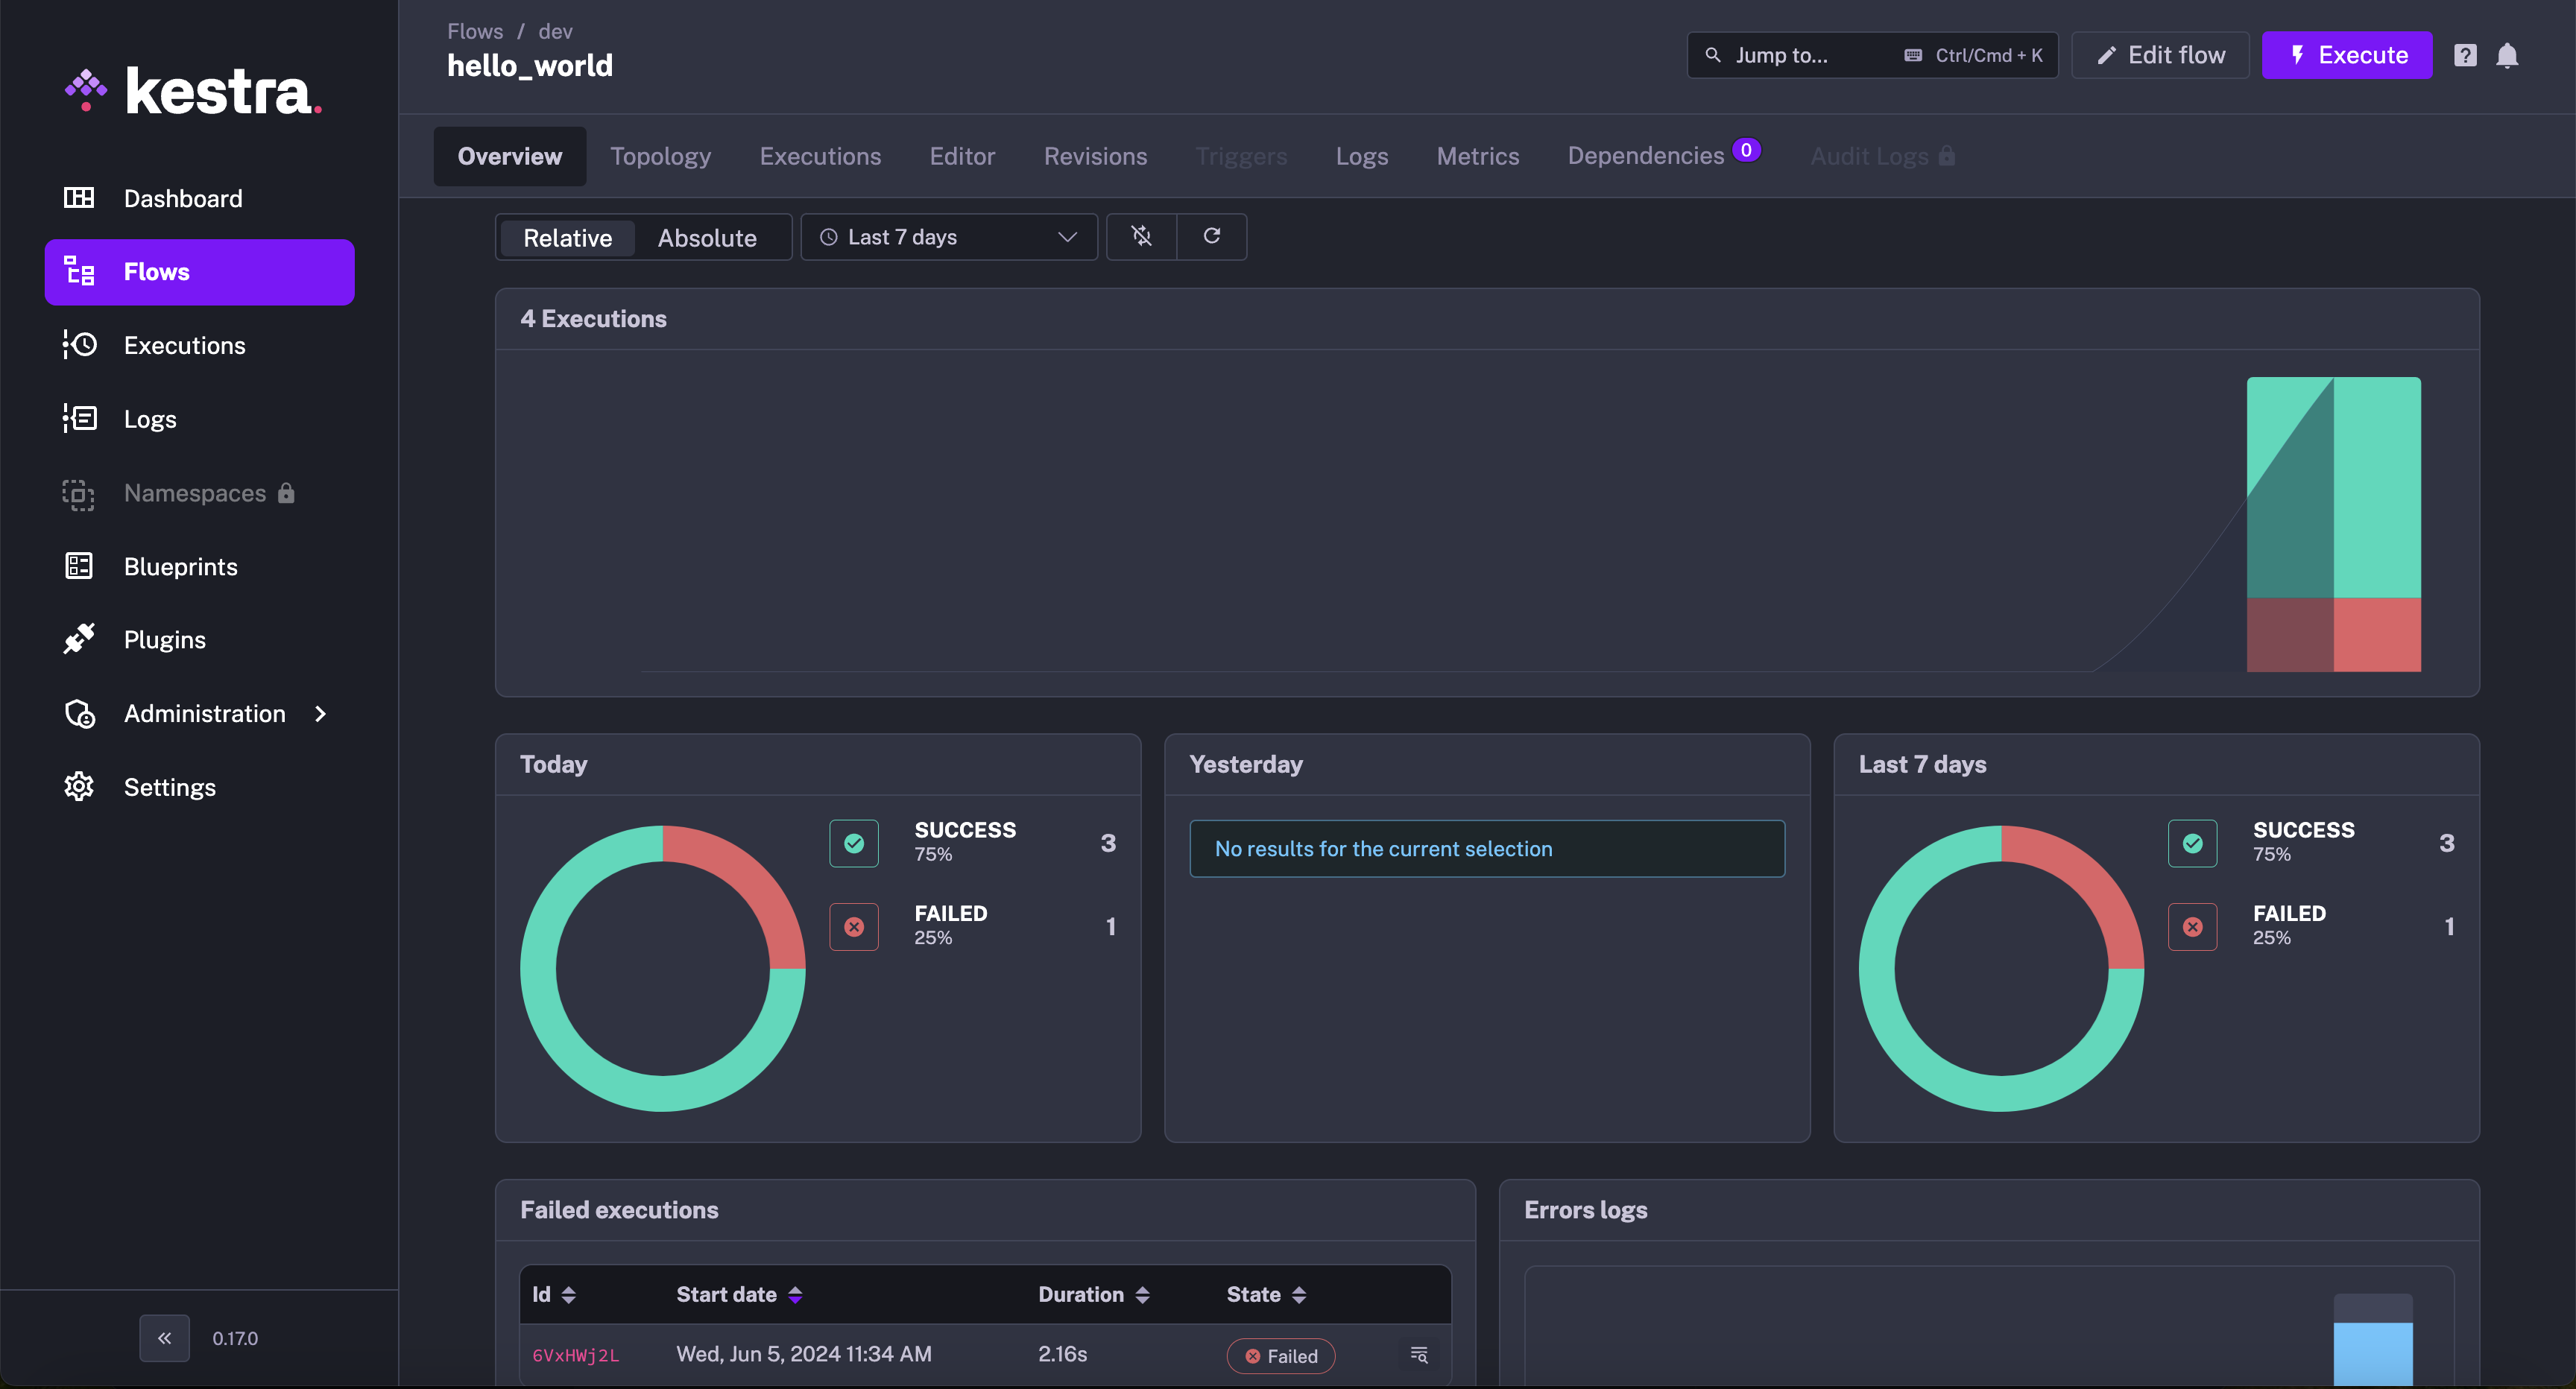
A Flow page will have multiple tabs that allow you to: see the flow topology, all flow executions, edit the flow, view its revisions, logs, metrics, and dependencies. You'll also be able to edit namespace files in the Flow editor as well.
Executions
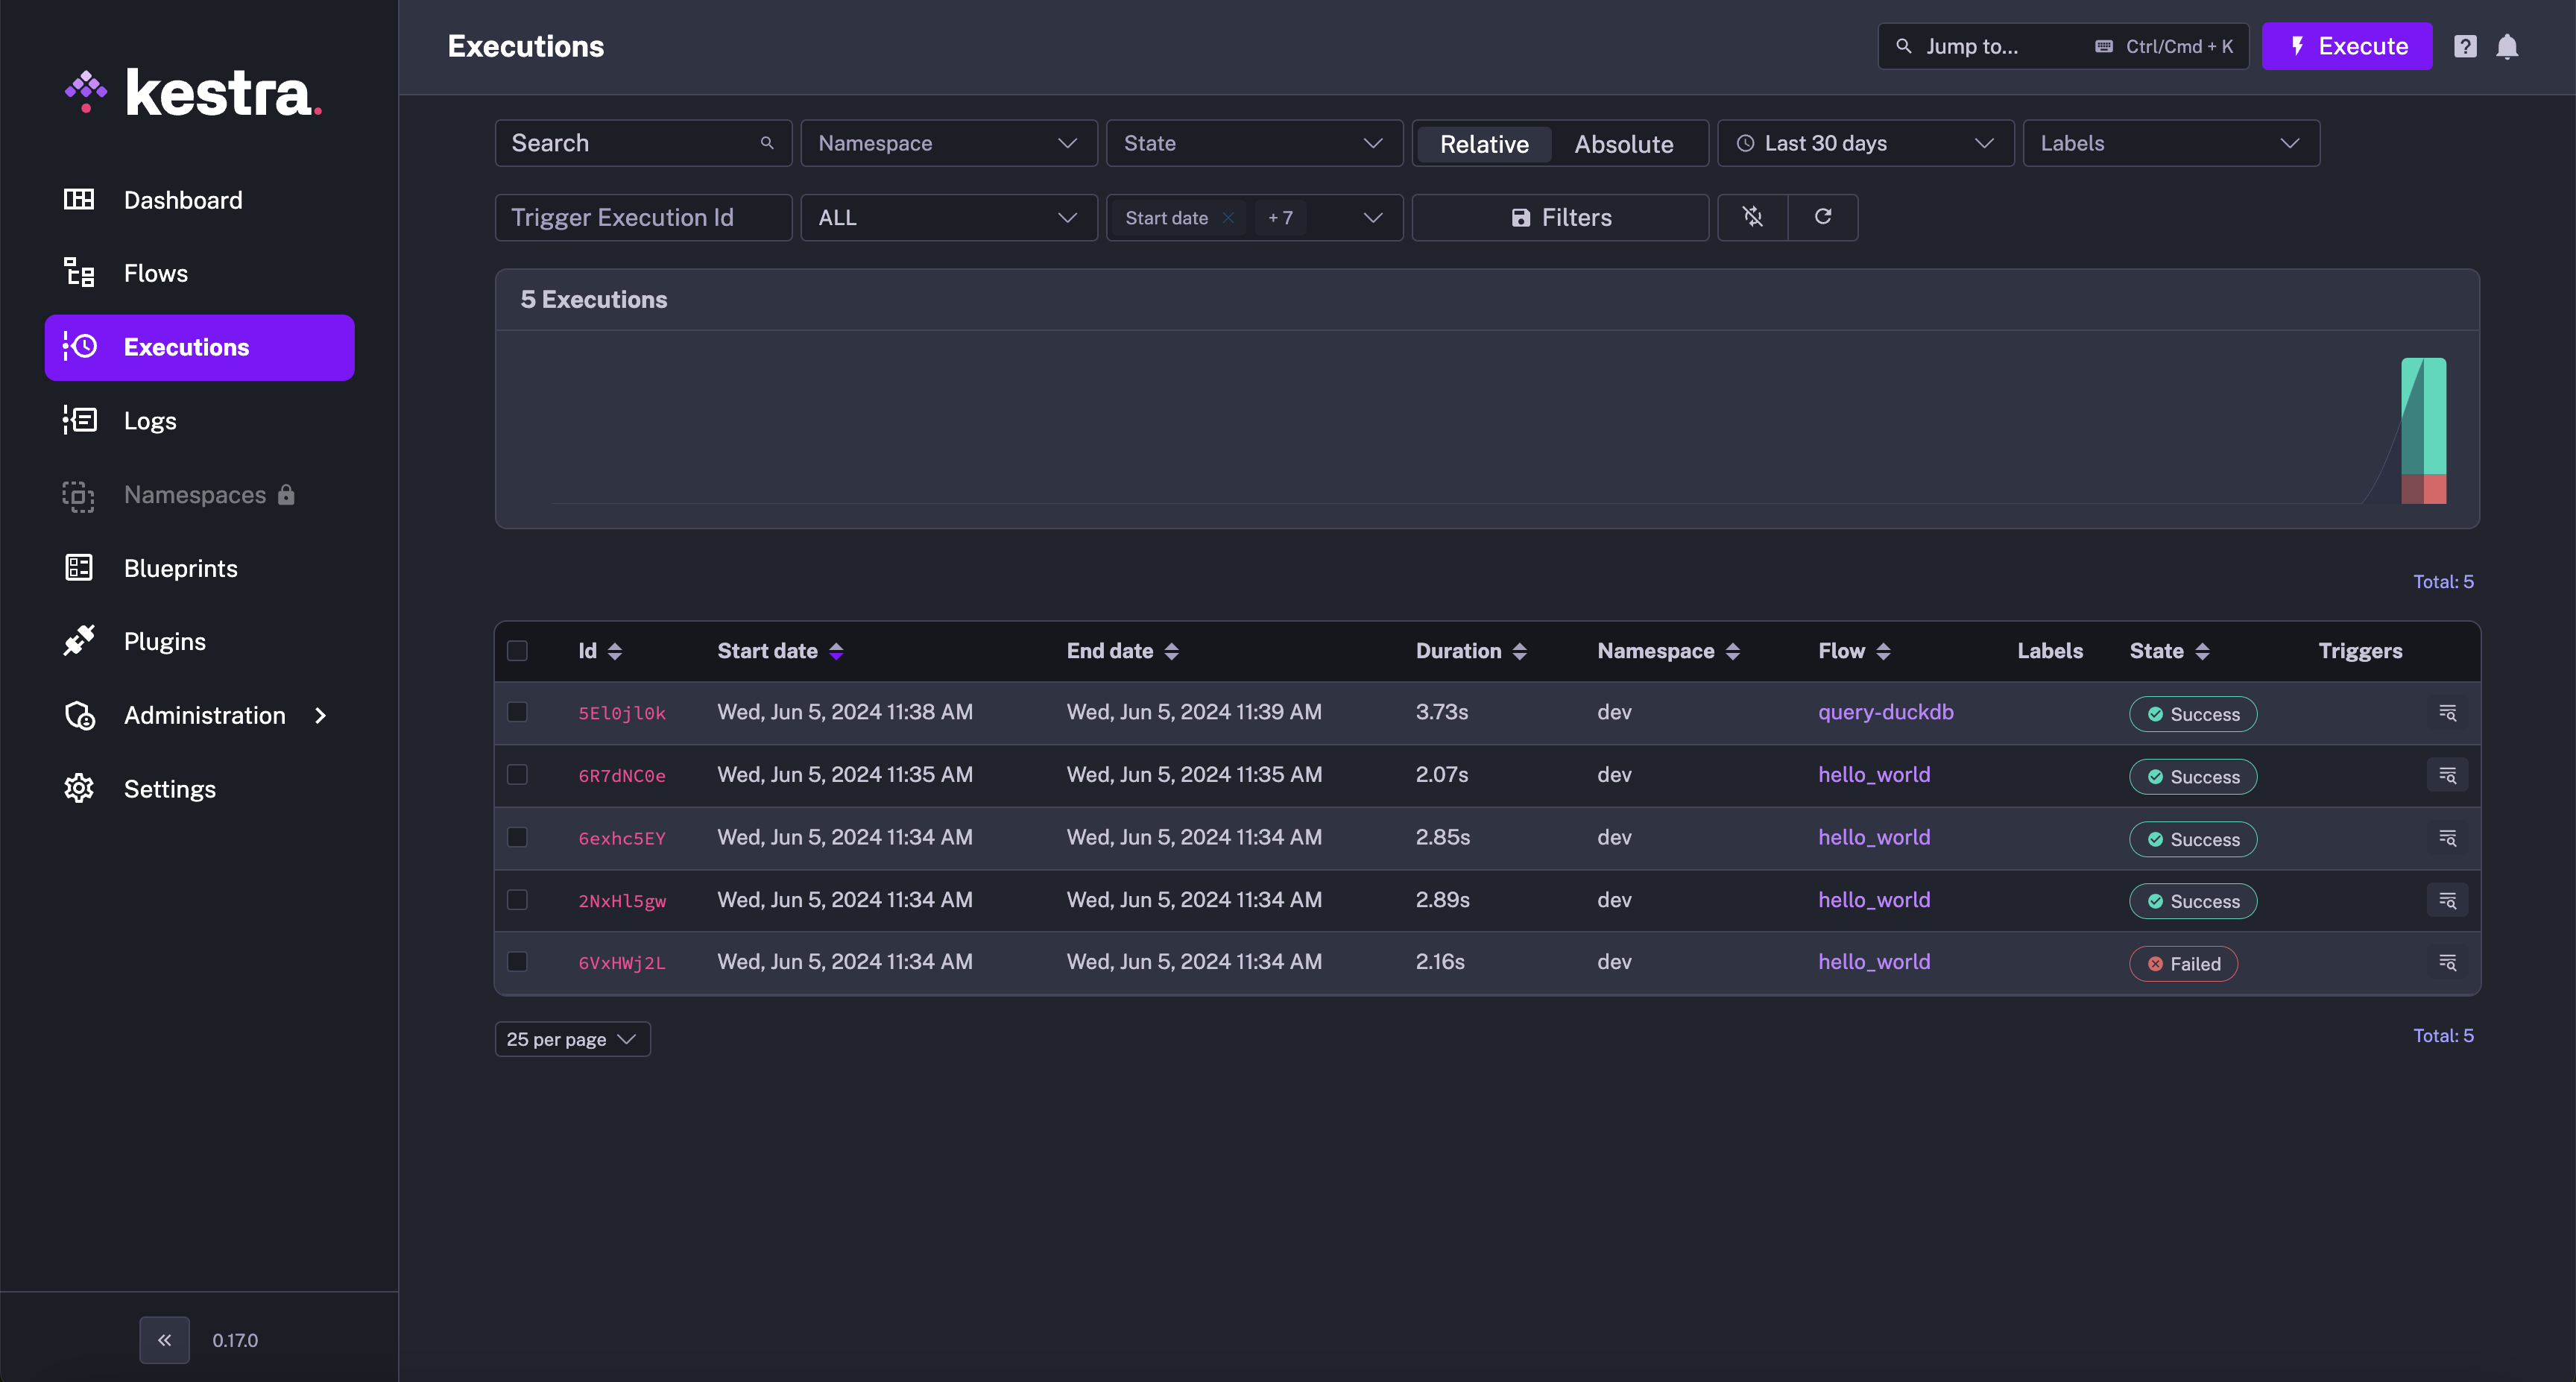
On the Executions page, you will see a list of previous flow executions.
By clicking on an execution id or on the eye icon, you can open an execution.
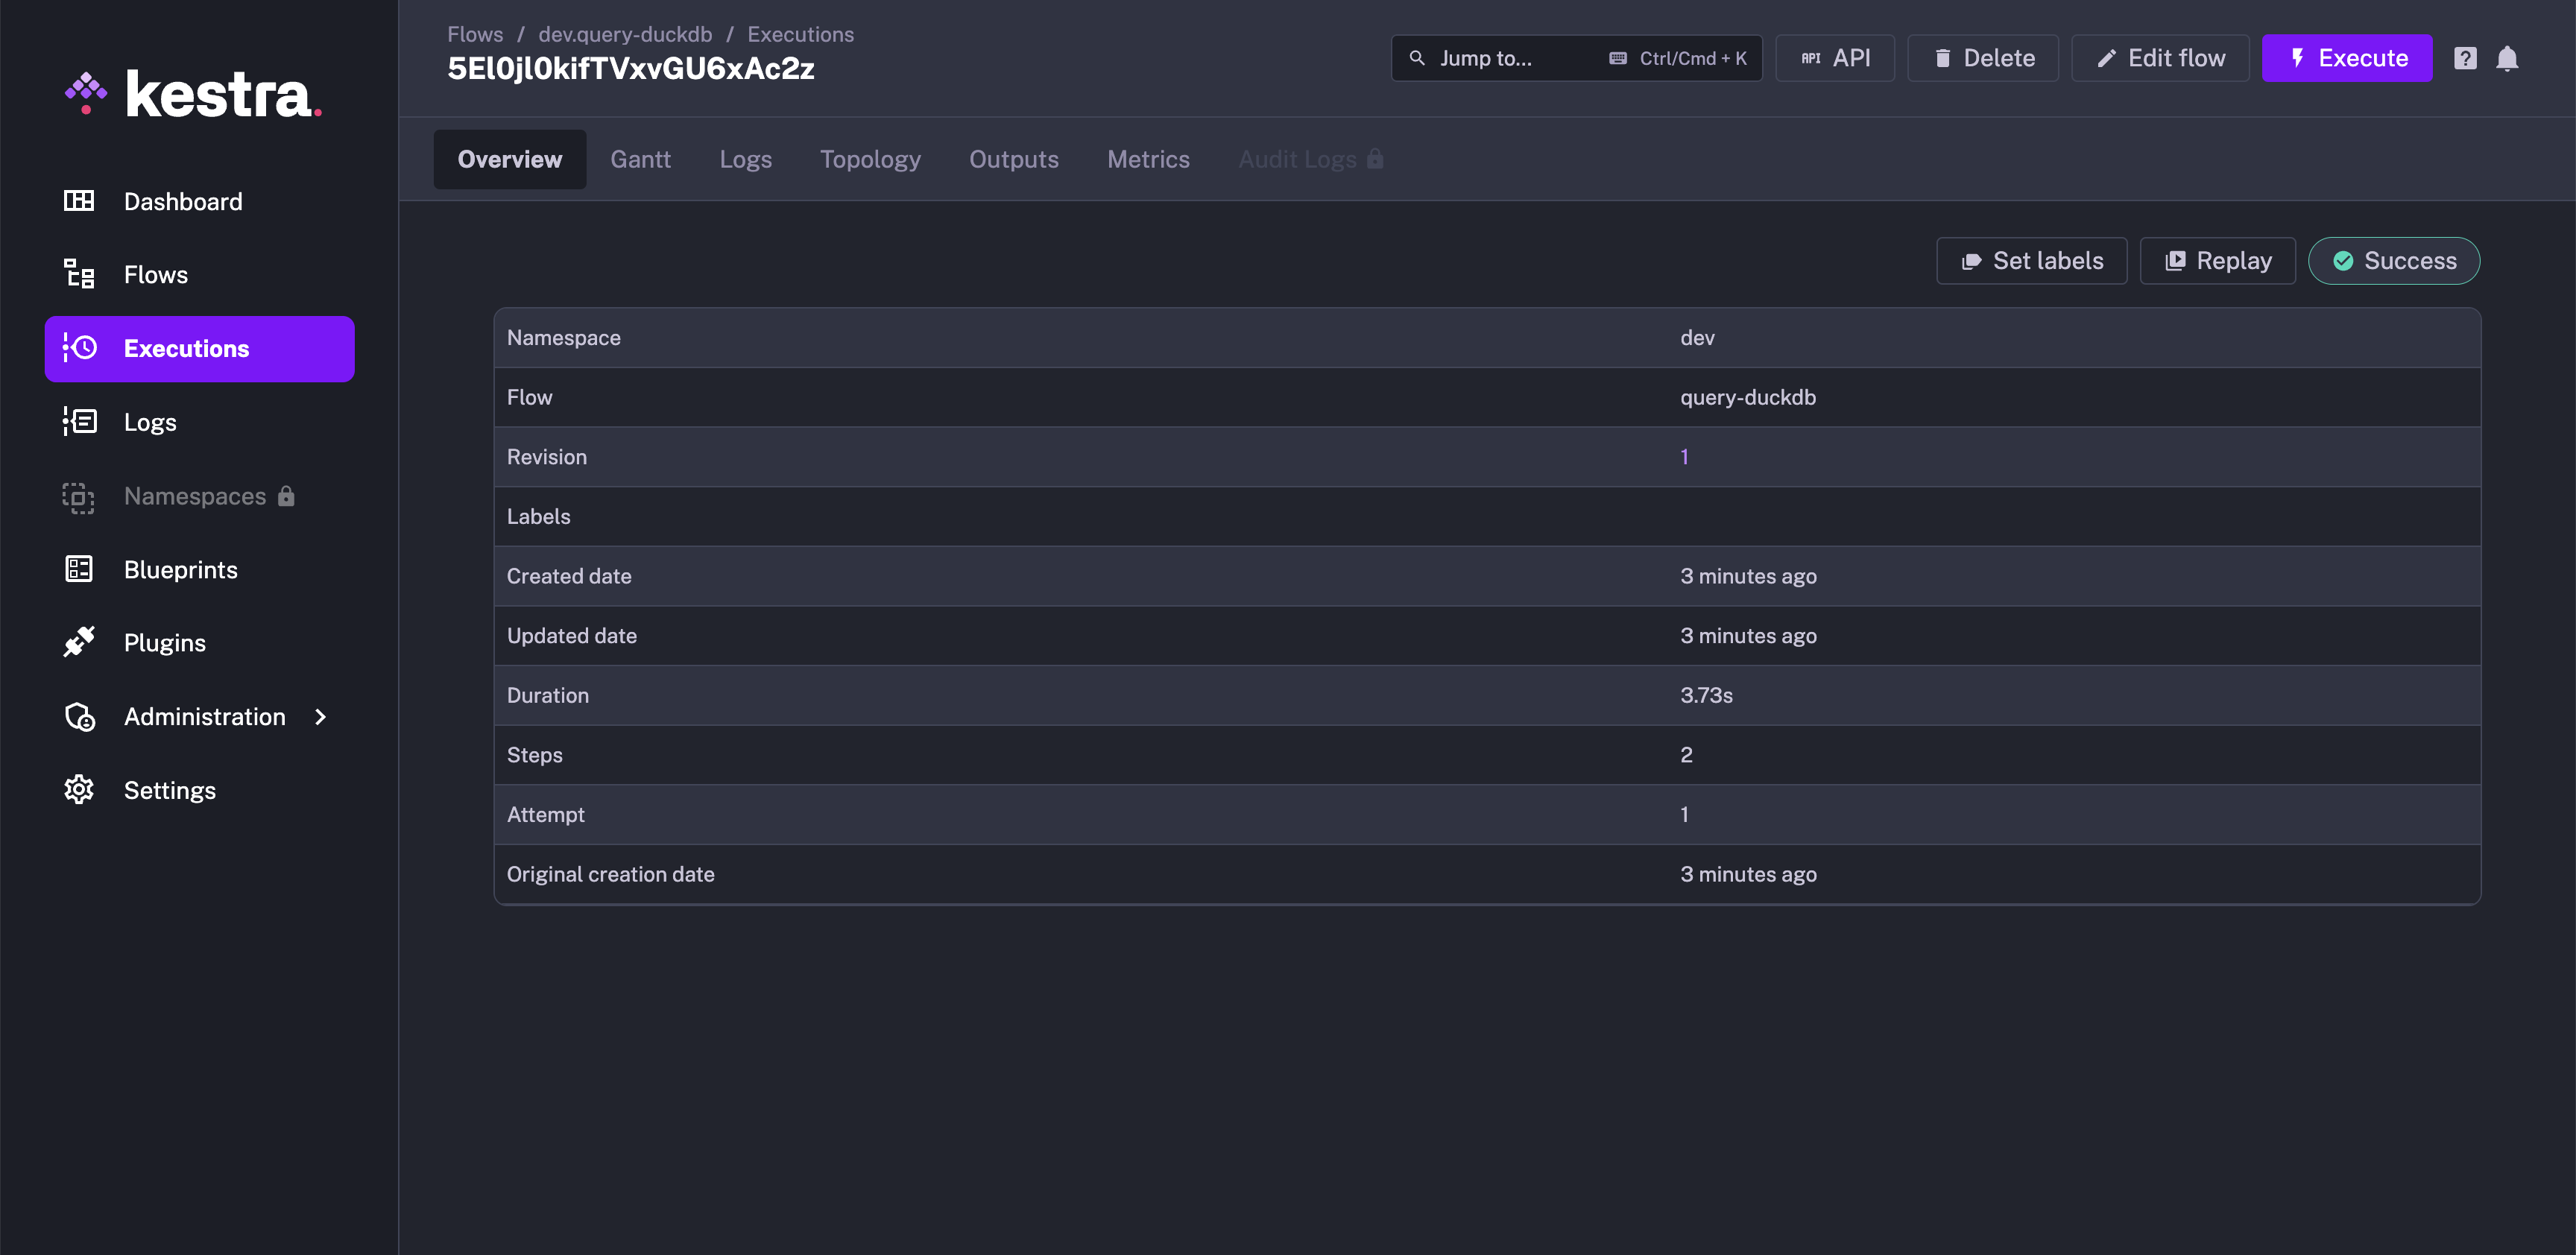
An Execution page will allow you to access the details of a flow execution, including logs, outputs, and metrics.
Gantt
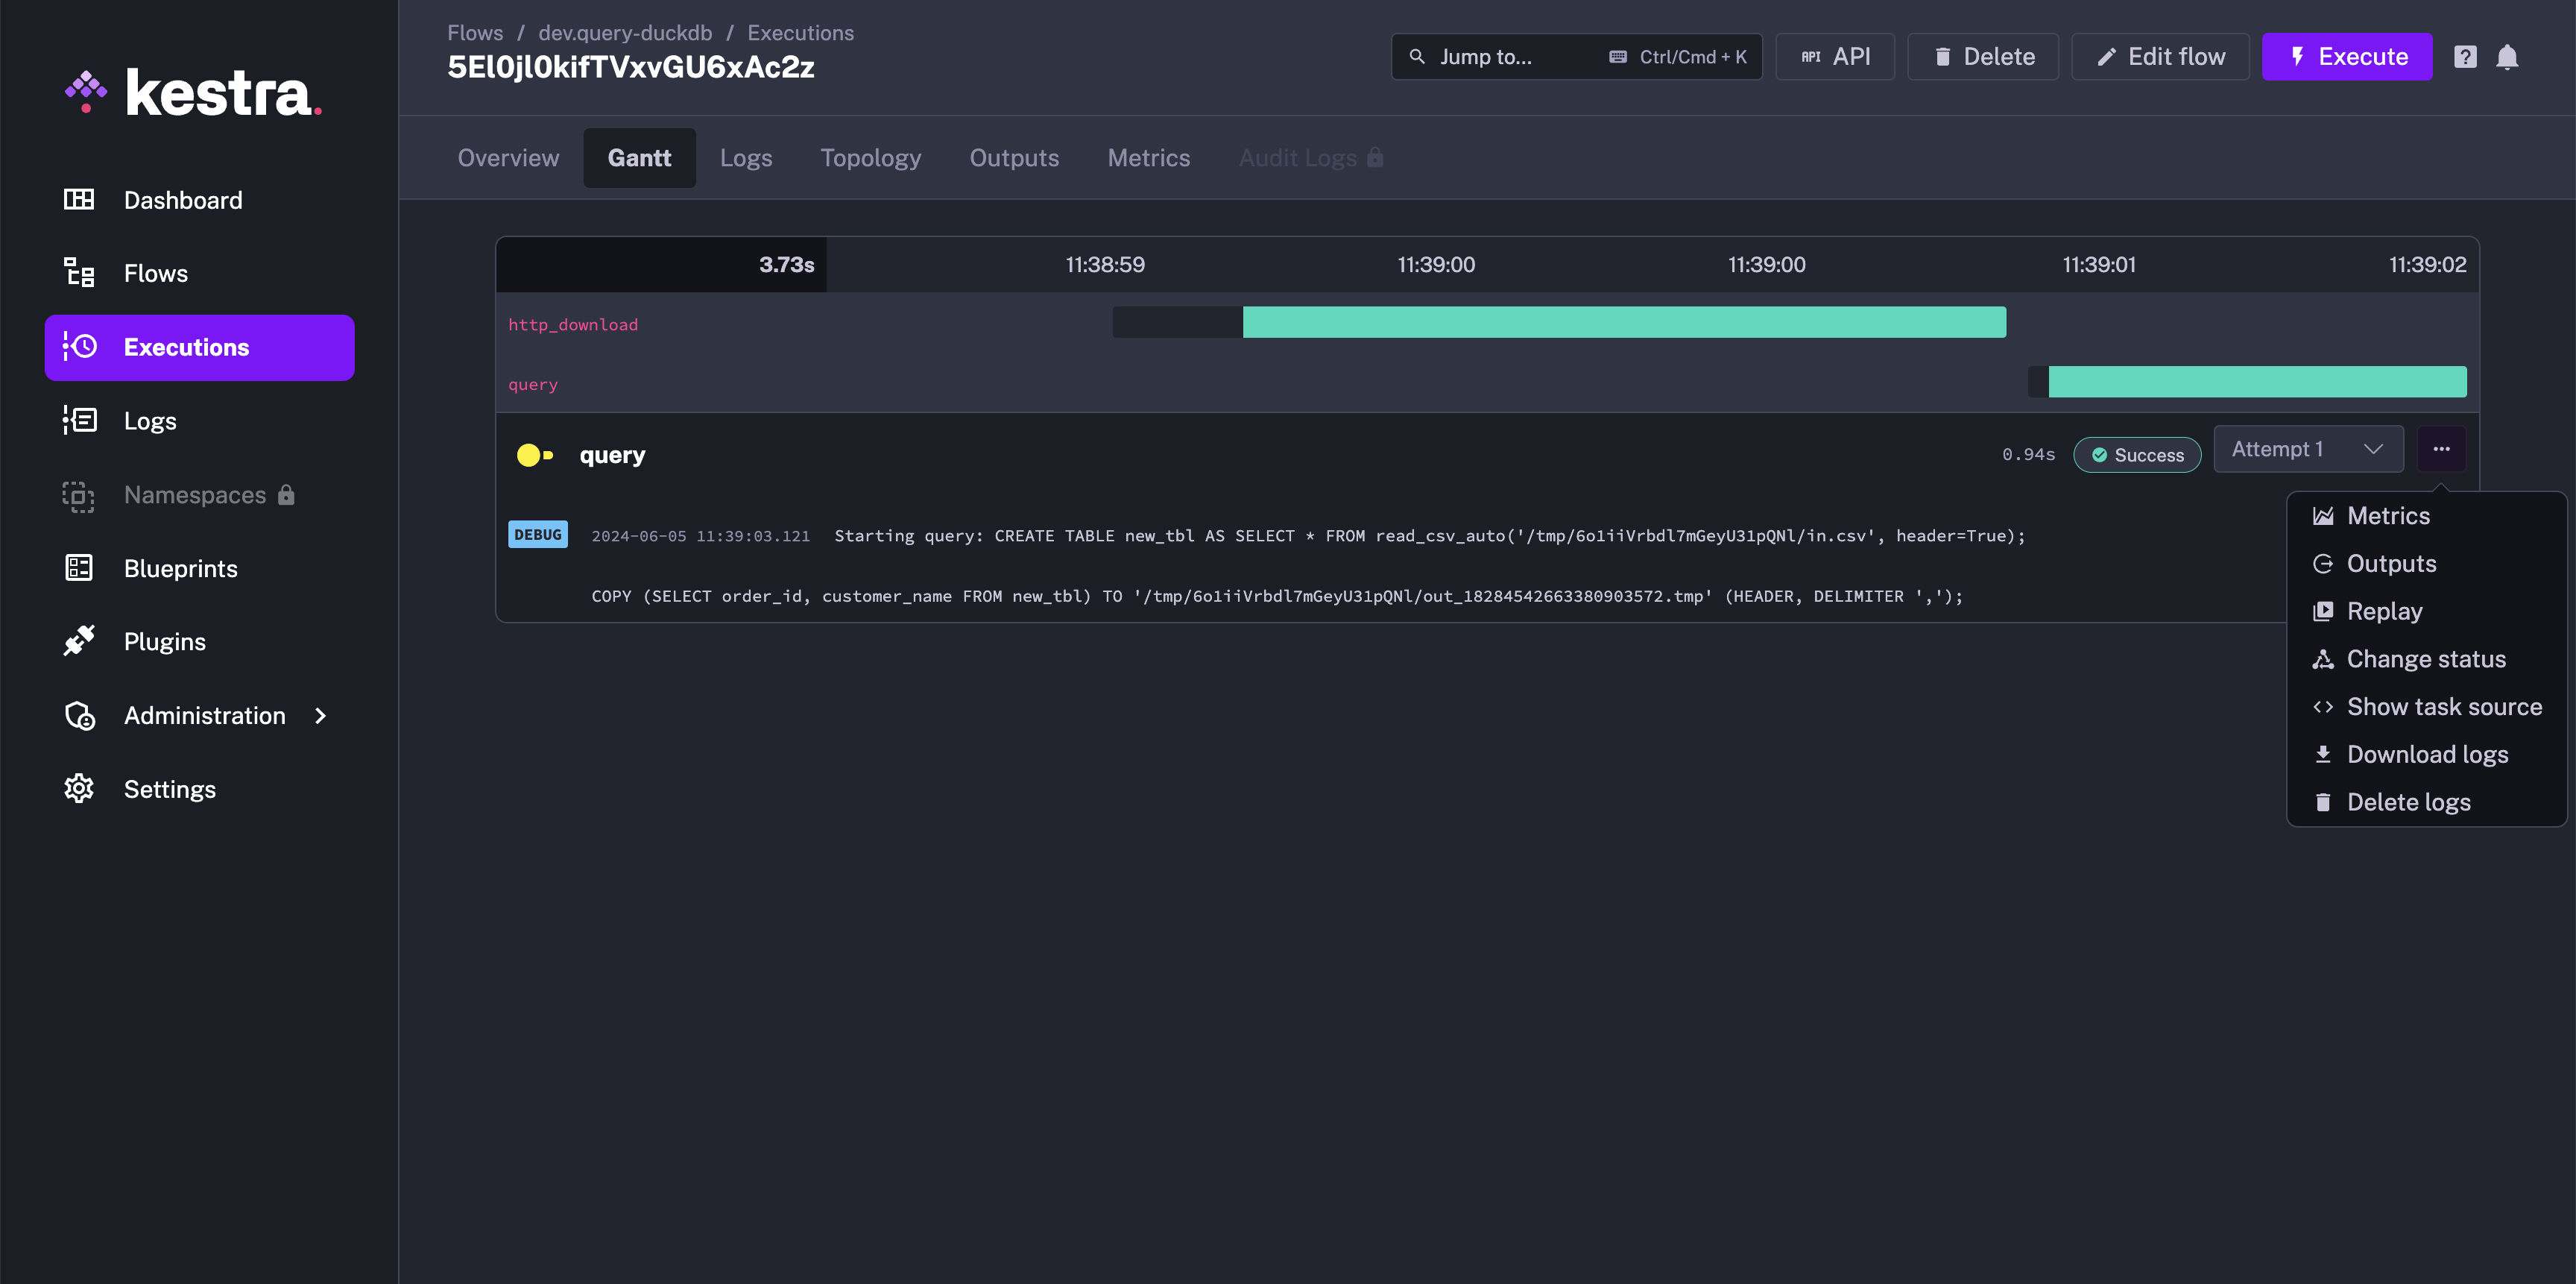
The Gantt tab allows you to see each task's durations. From this interface, you can replay a specific task, see task source code, change task status, or look at task metrics and outputs.
Logs
The Logs tab allows to access task's logs. You can filter by log level, copy logs in your clipboard, or download logs as a file.
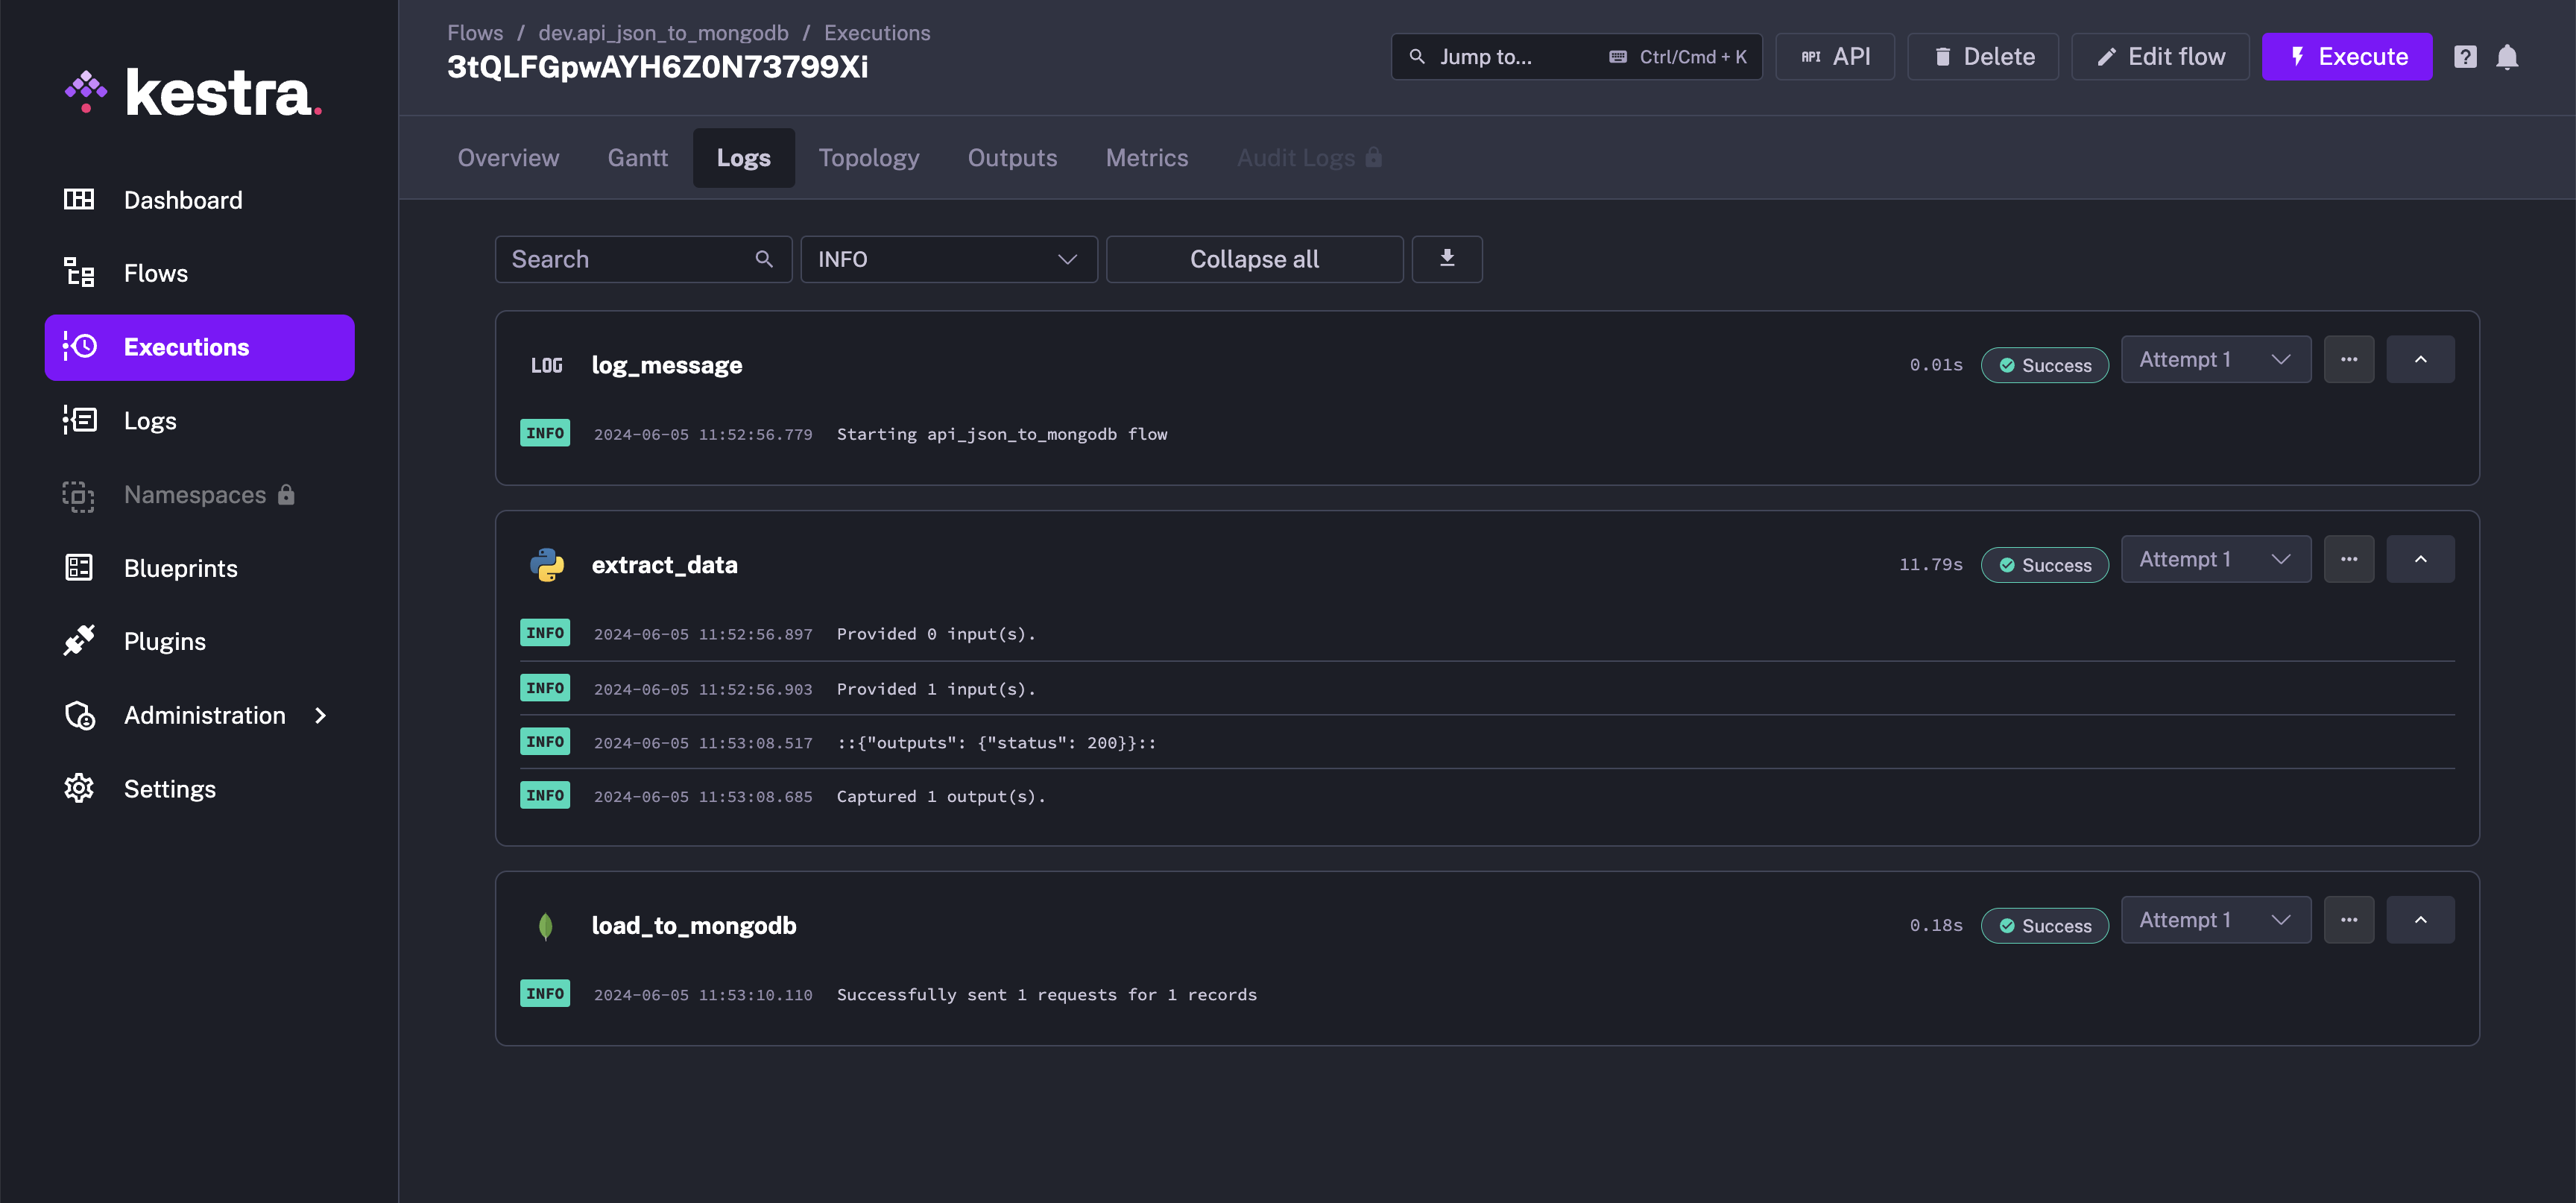
Topology
Similar to the Editor view, you can see your execution topology. From this, you can access specific task logs, replay certain tasks or change task status.
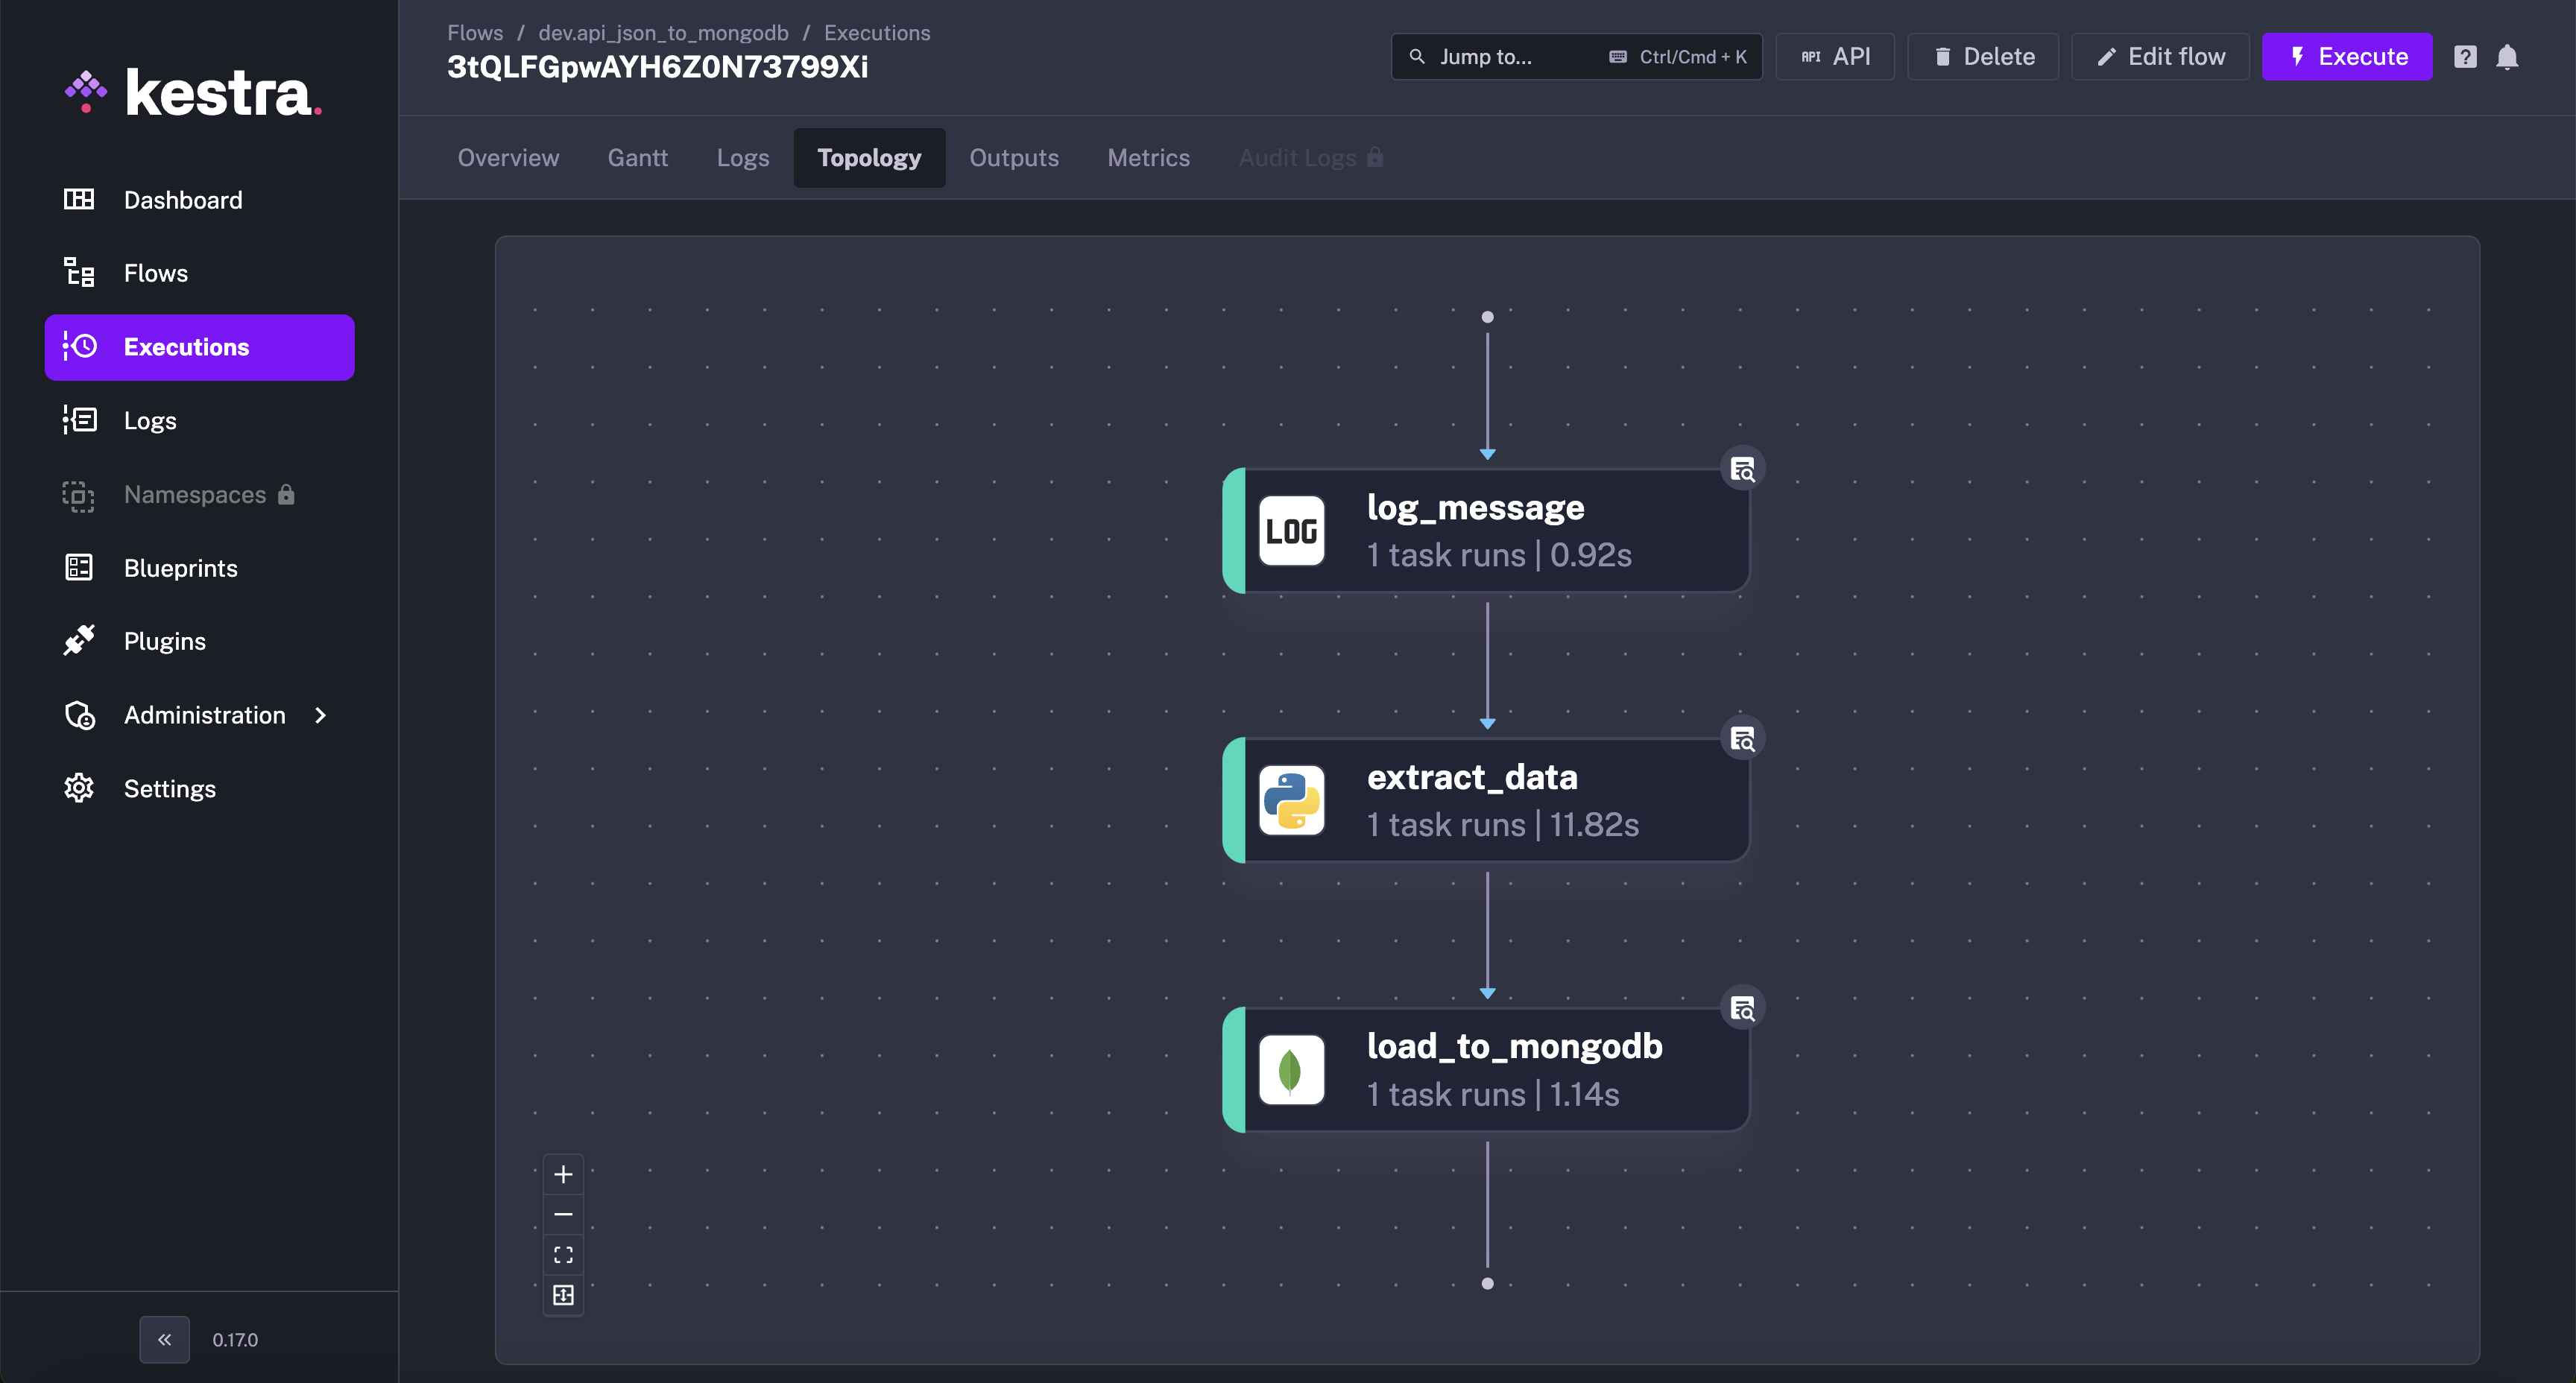
Outputs
The Outputs tab inside of an execution page allows to see each task's outputs.
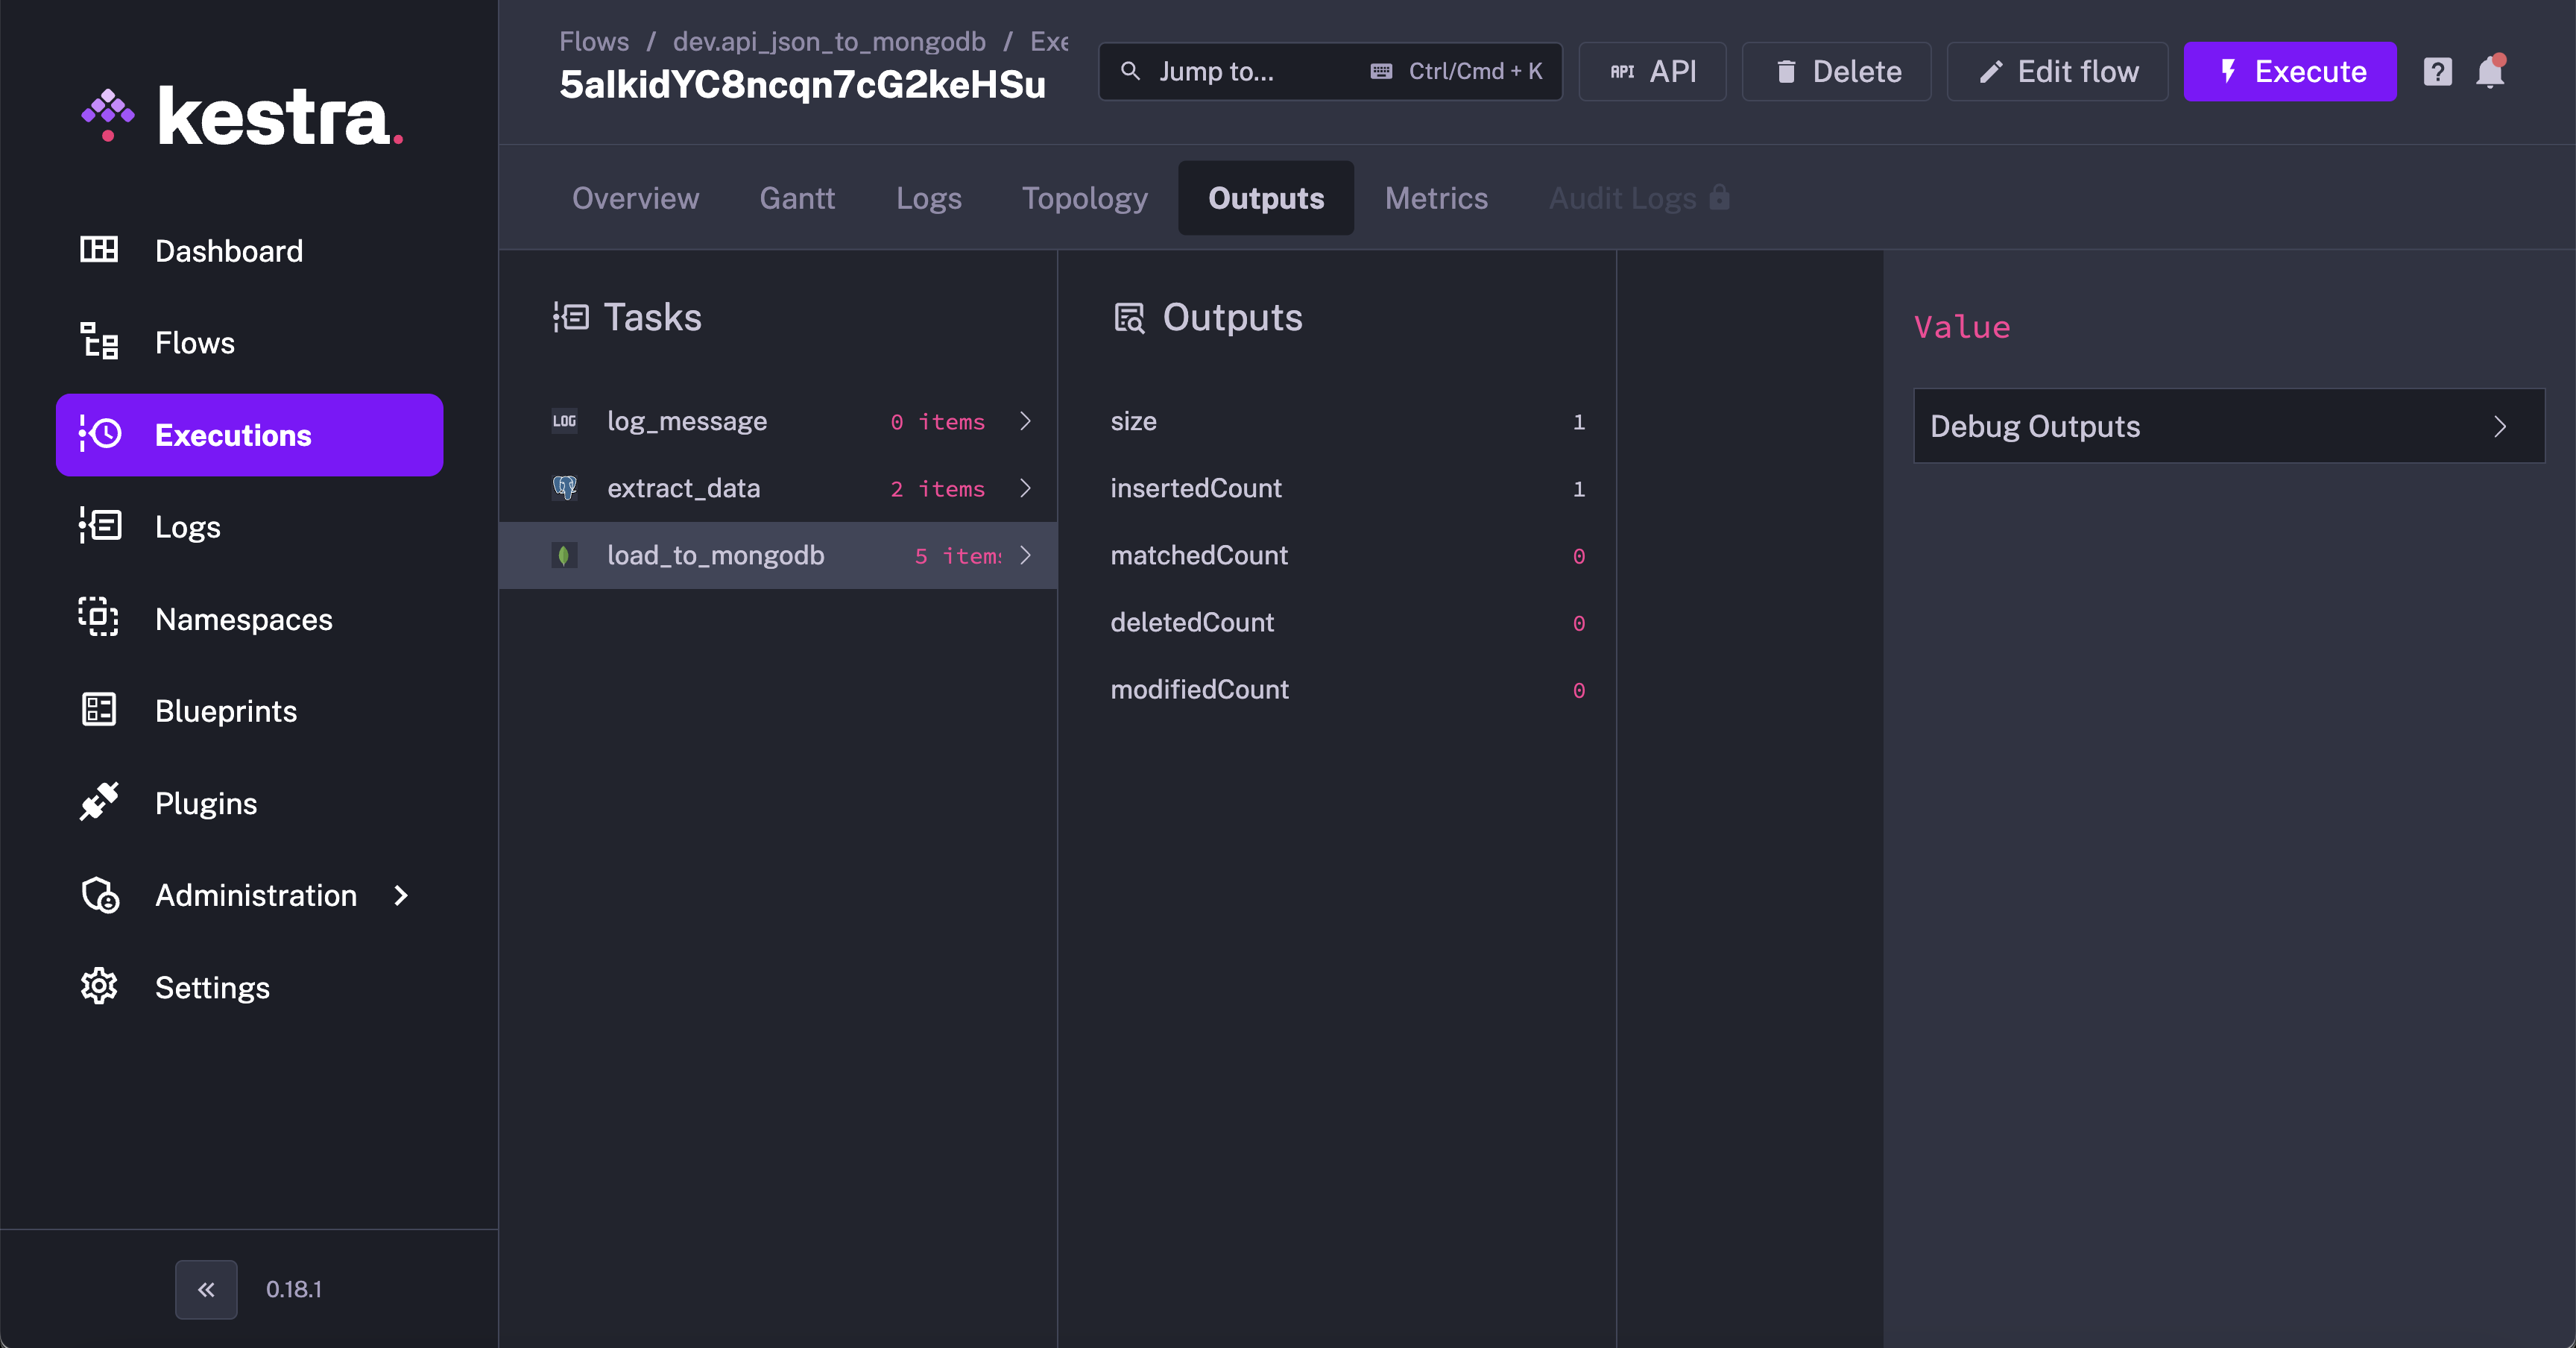
The "Debug Outputs" box allows to evaluate expressions on those task outputs. It's a great way to debug your flows.
Note: You have to select one task to be able to use the "Debug Outputs" button.
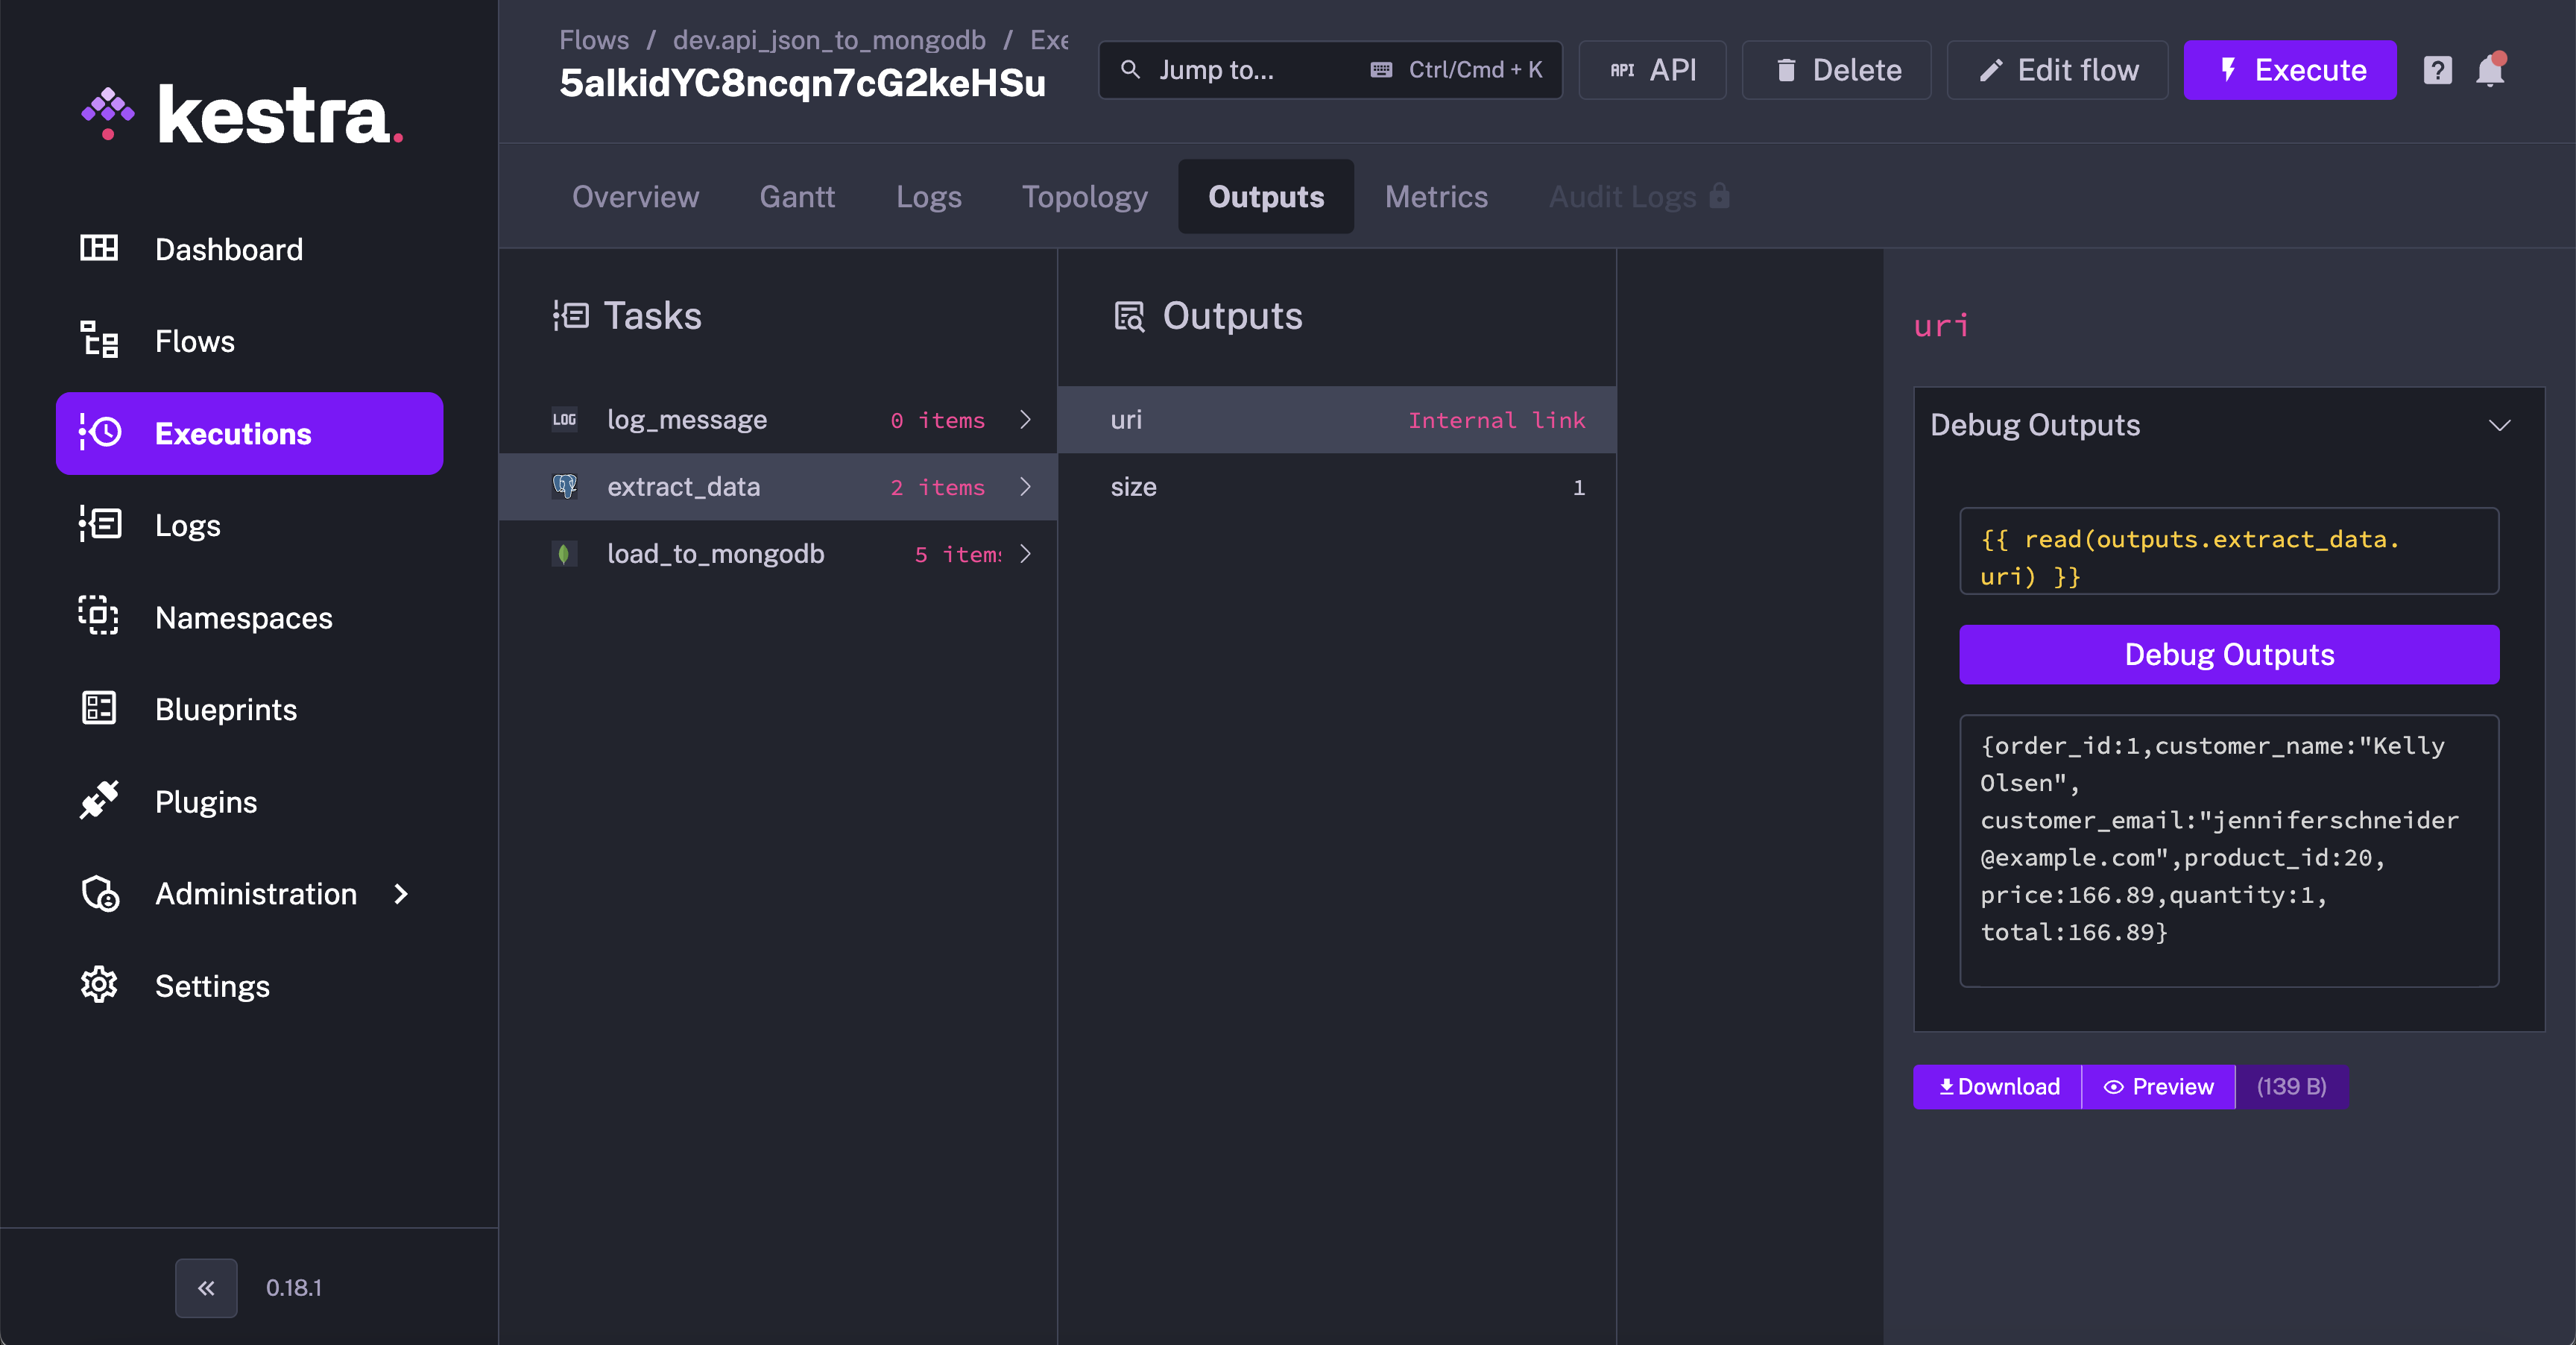
For example, you can use the "Render expression" feature to deep-dive into your tasks' outputs and play directly with expressions.
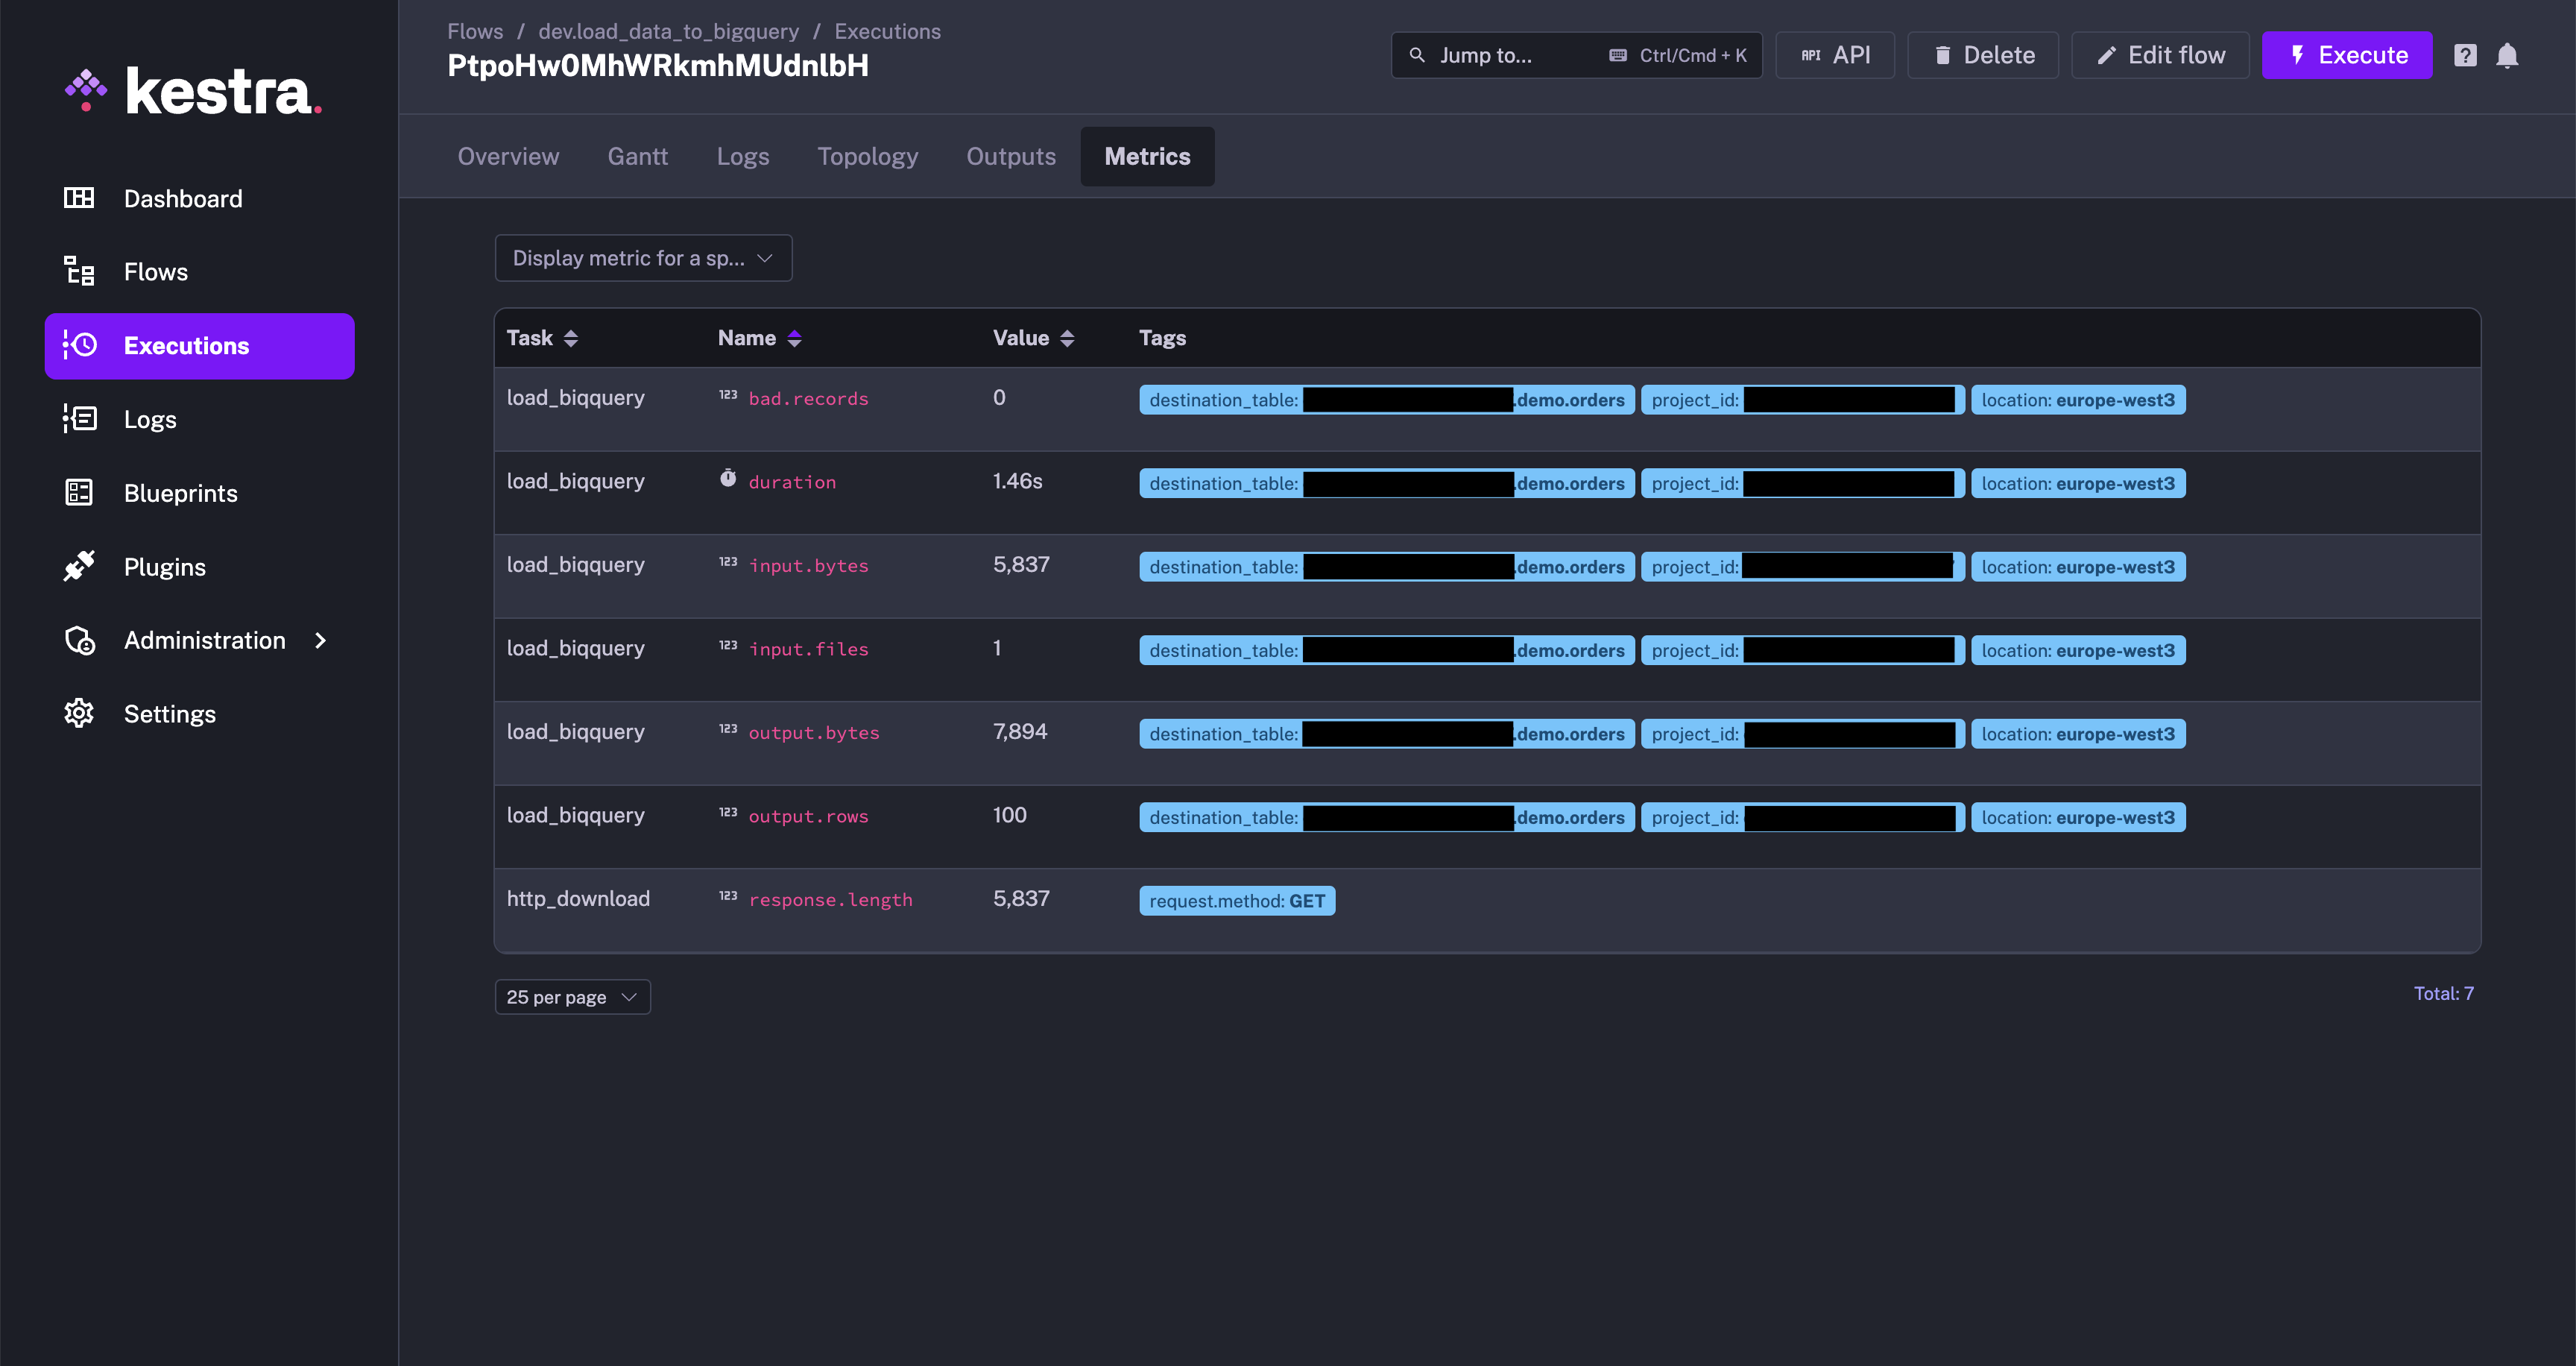
Metrics
The Metrics tab shows every metric exposed by tasks after execution.
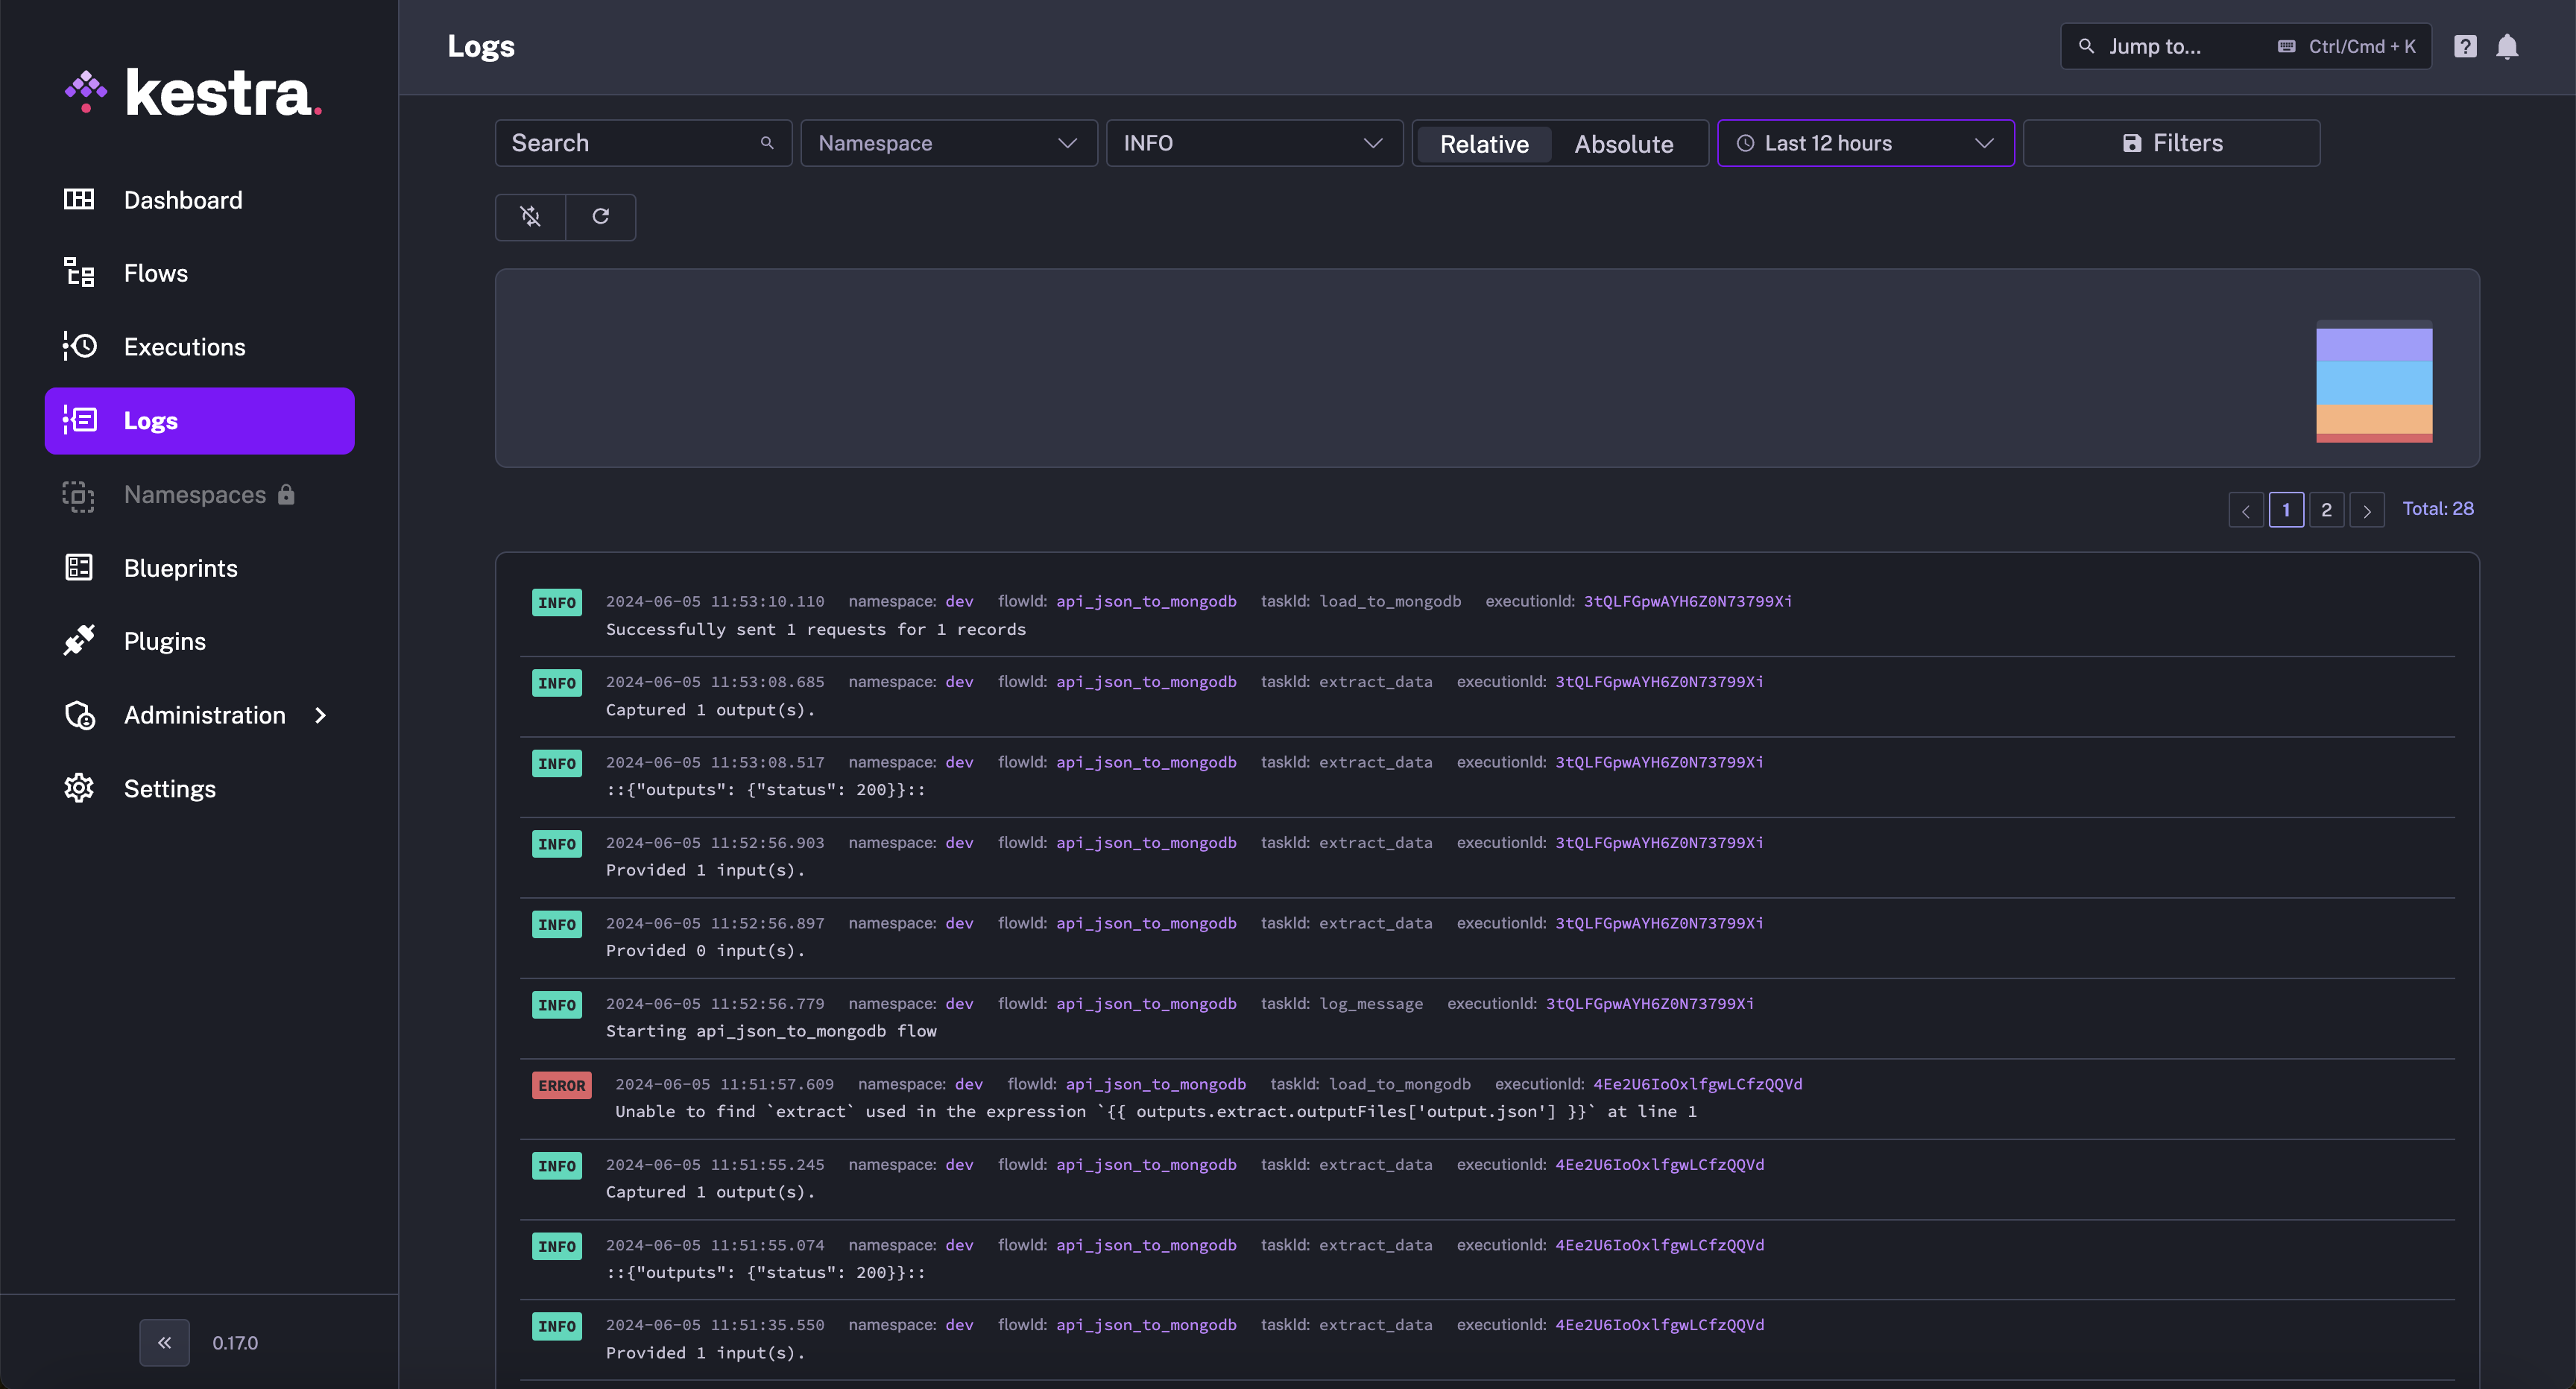
Logs
On the Logs page, you will have access to all task logs.
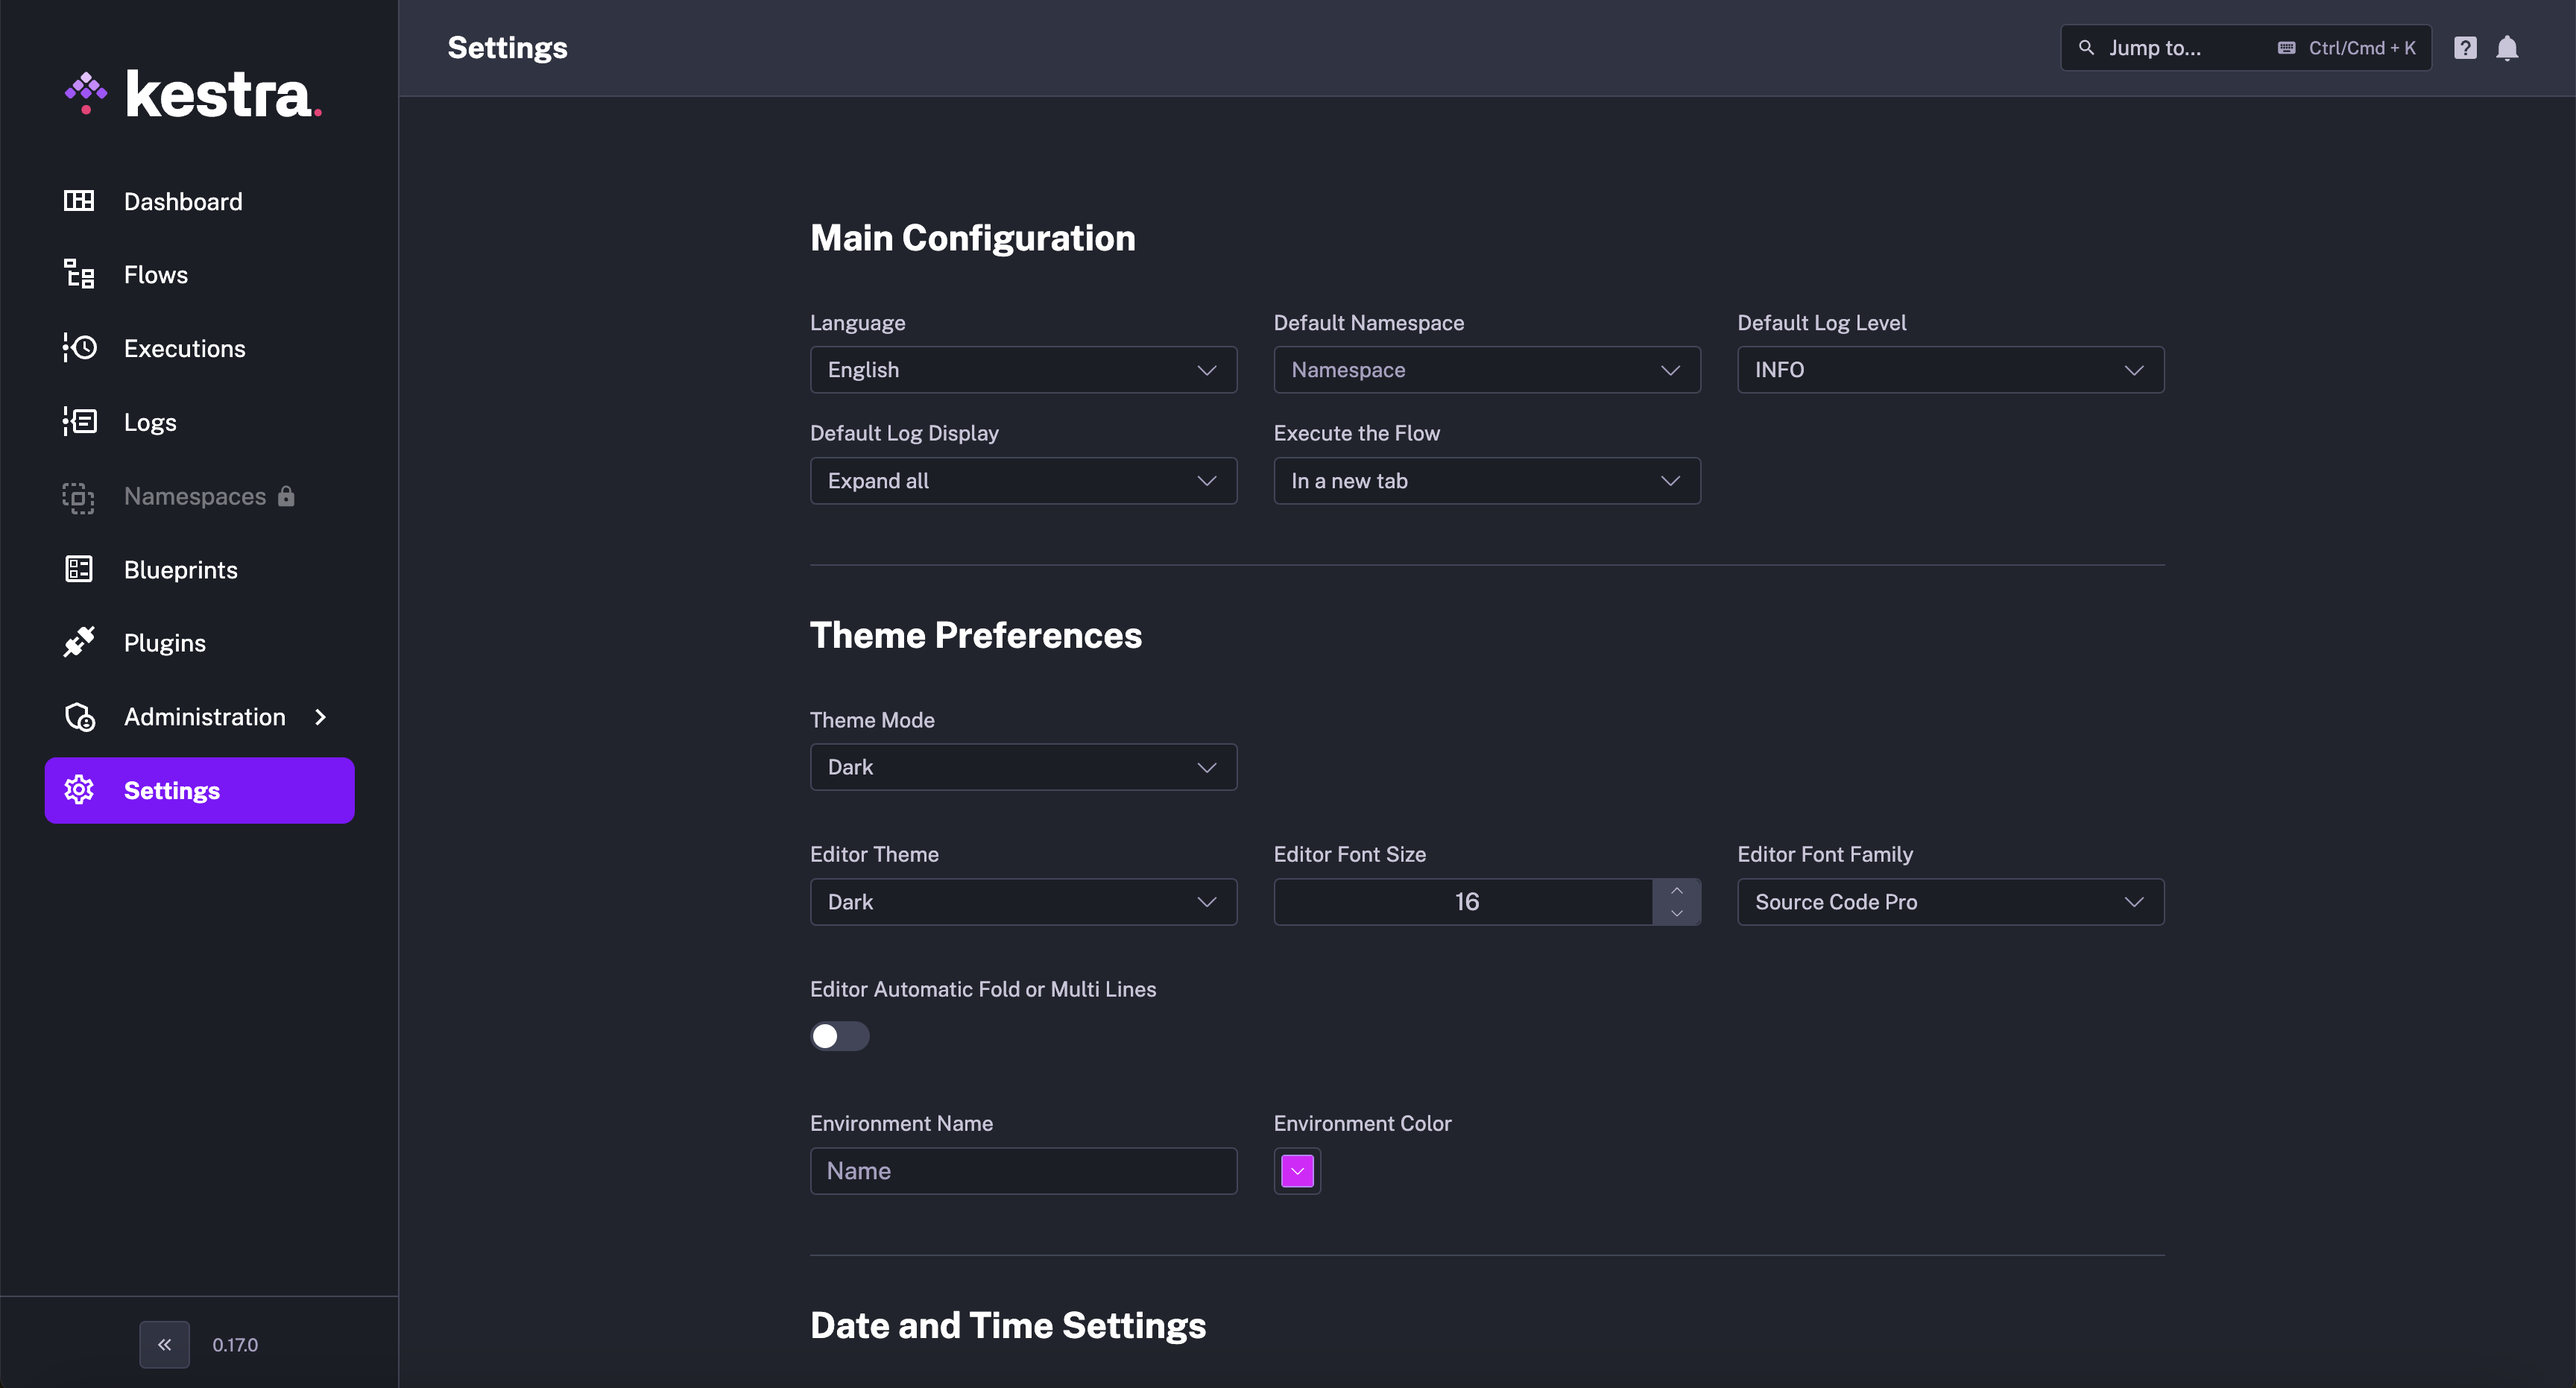
Settings
On the Settings page, you will be able to configure the Kestra UI. These configuration options are on a per-user basis.
Task Runs (EE)
This feature requires a commercial license and backend with the Elasticsearch repository.
On the Task Runs page, you will see the list of task runs and some charts.
This page only exists when using the Elasticsearch repository, as it requires a full-text search engine.
Namespaces (EE)
This feature requires a commercial license.
When first accessing the Namespaces page, you will see the list of all Kestra flow namespaces (including parents, as namespaces are hierarchical like a directory tree), but you will not be able to configure a namespace before creating it.
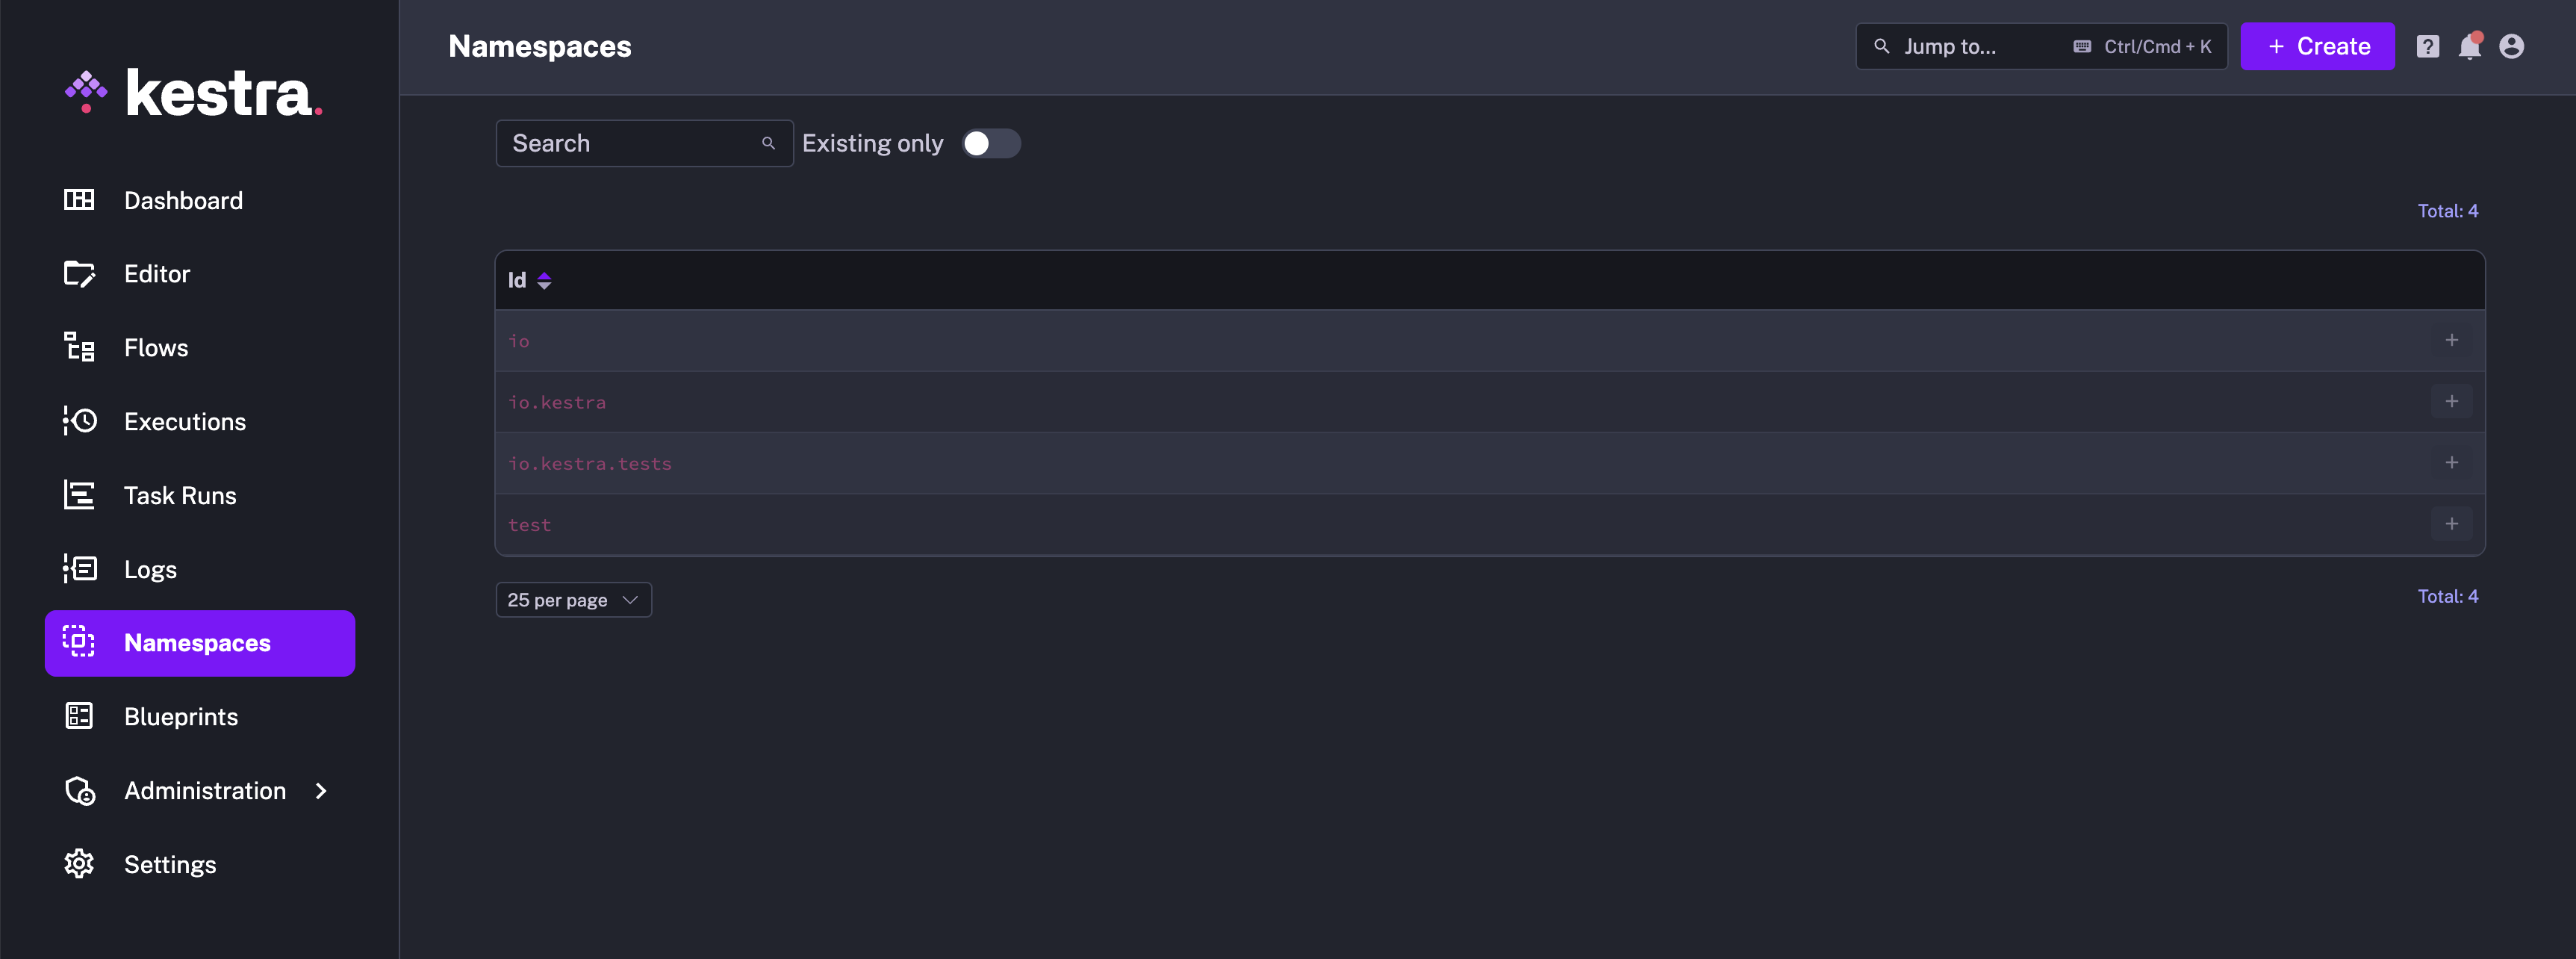
You can click on the Create button at the top right on the Namespaces page to create it.
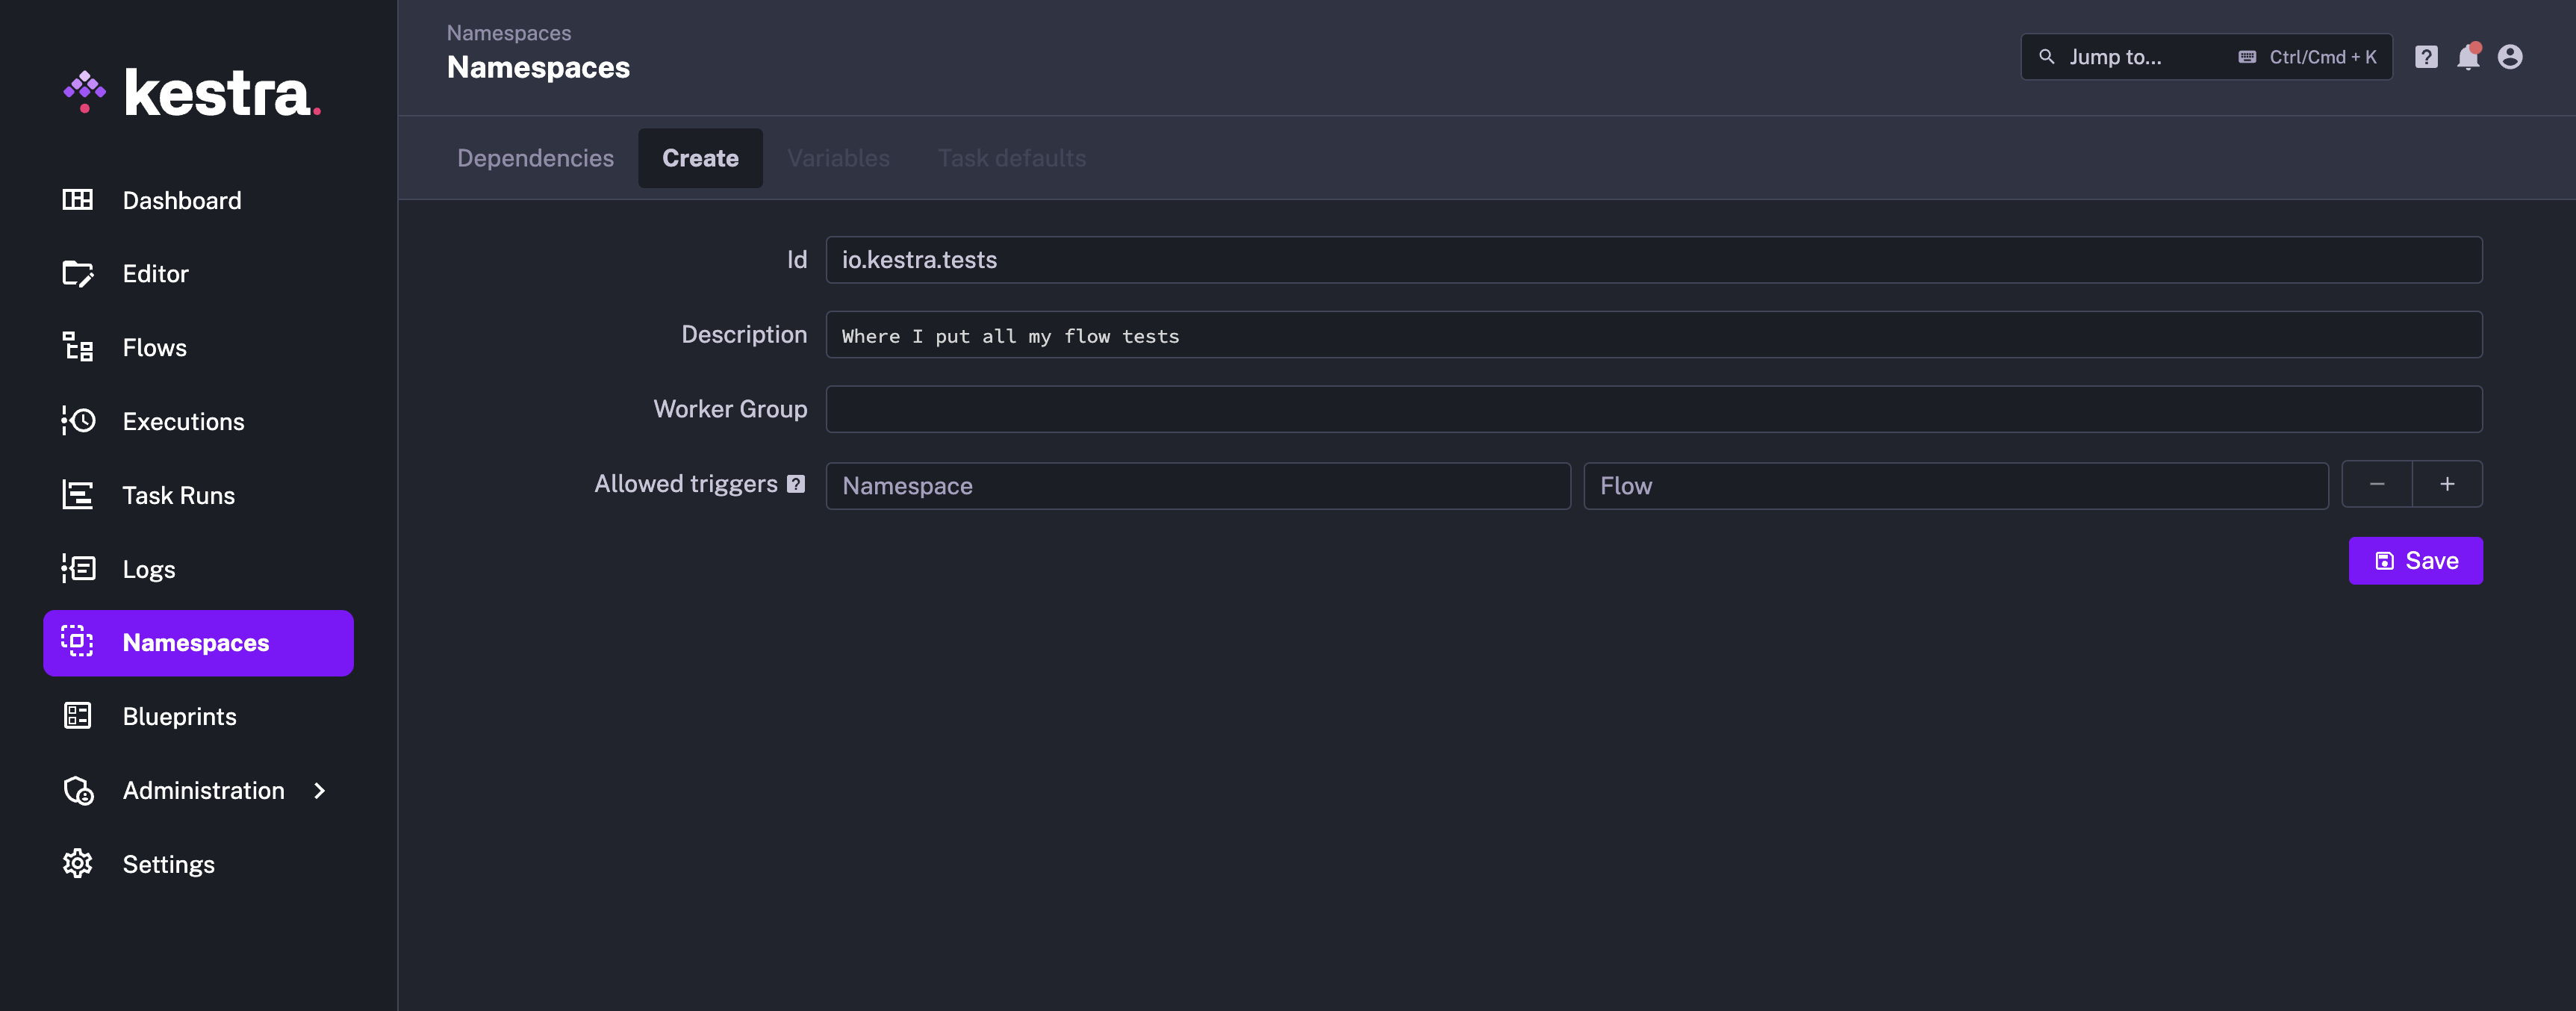
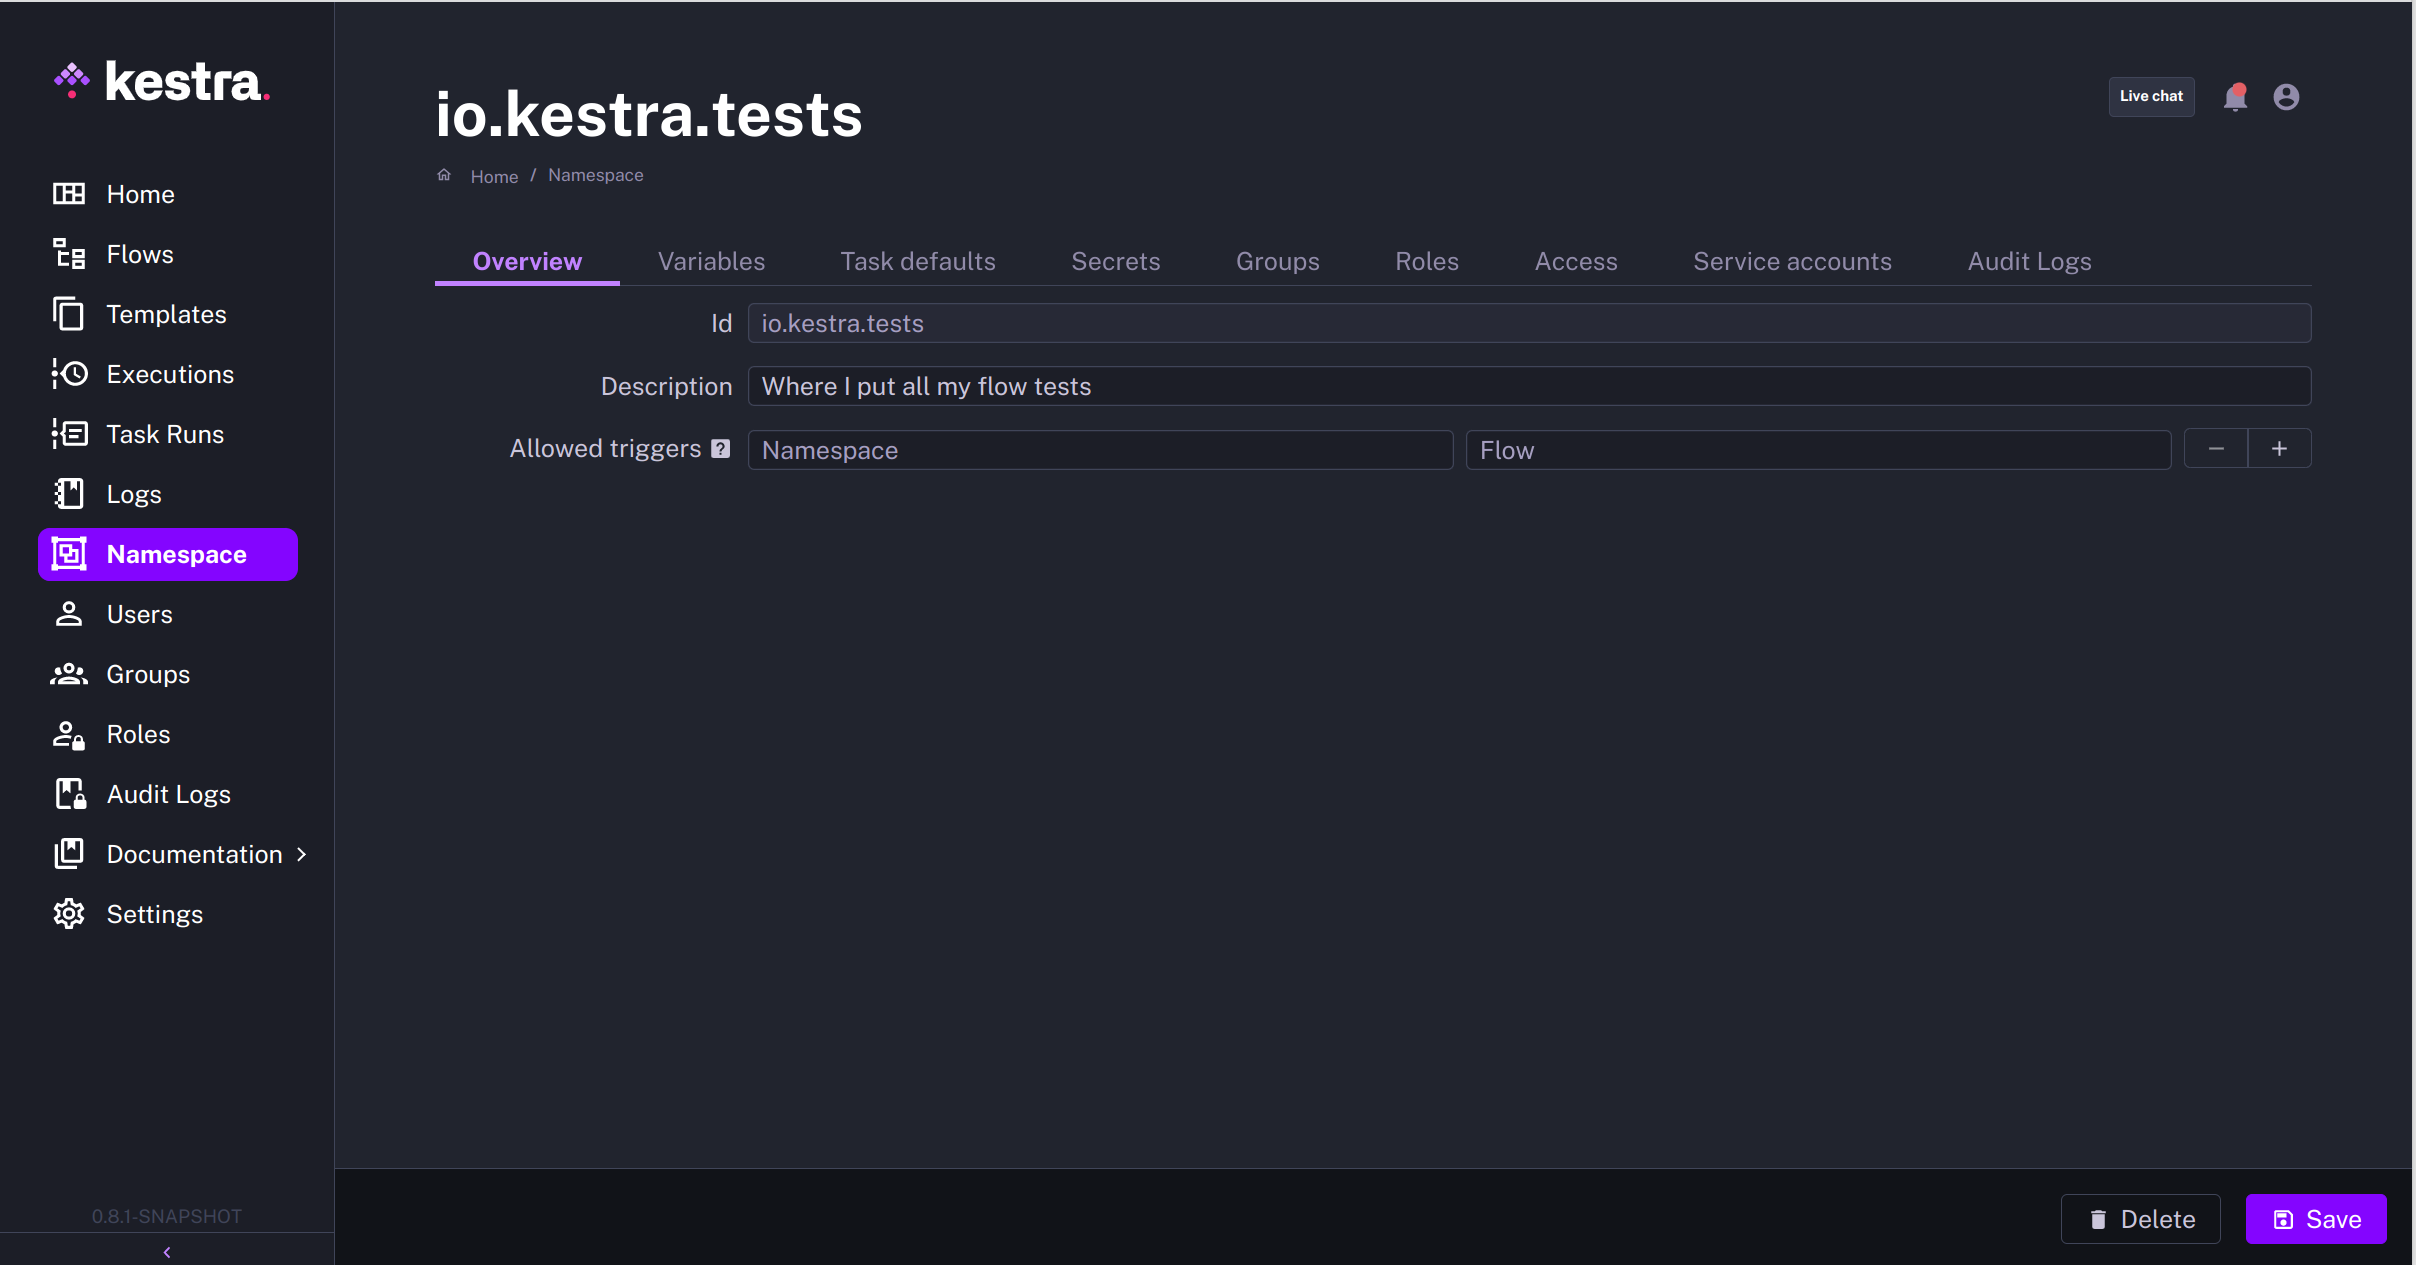
After creating a namespace, you can configure it:
- The Variables tab allows setting Namespace Variables.
- The plugin defaults tab allows setting task default scoped to a namespace.
- The Secrets tab allows setting Namespace Secrets
- The Groups, Roles, and Access tabs allow managing role-based access control.
- The Service accounts tab allows managing service accounts to access Kestra as a service, and not as an end user.
- The Audit Logs tab allows access to the audit logs of the namespace.
Administration Section
Triggers
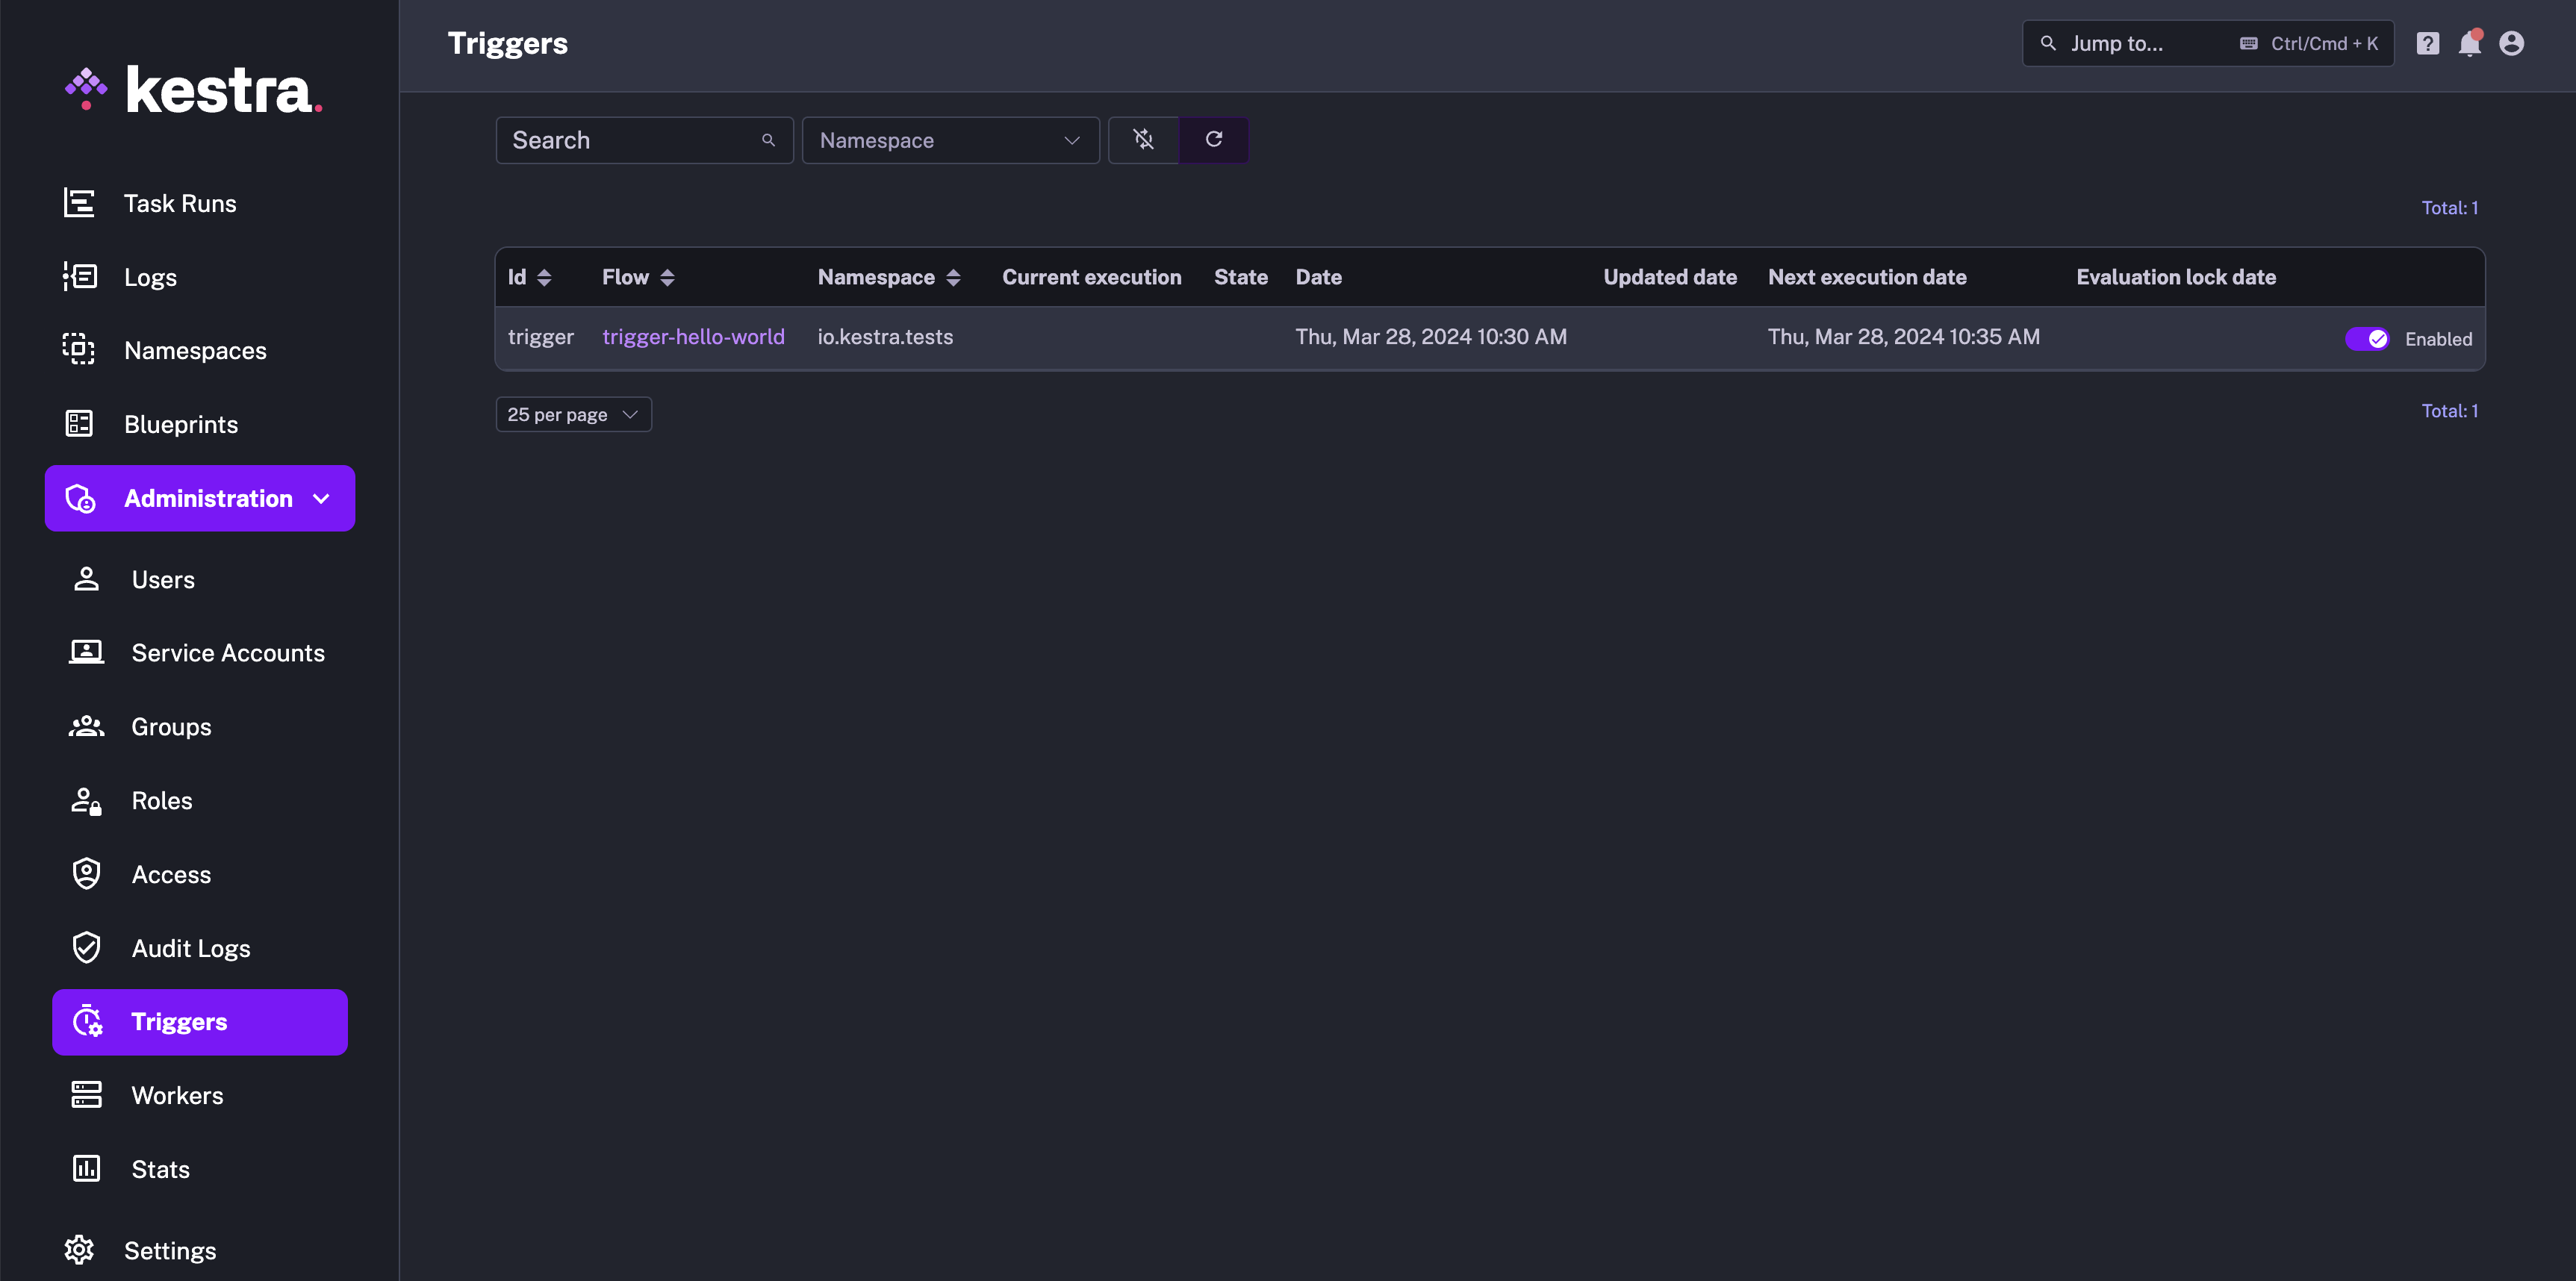
The Triggers page provides a concise overview of all triggers and their status, and allows you to disable, re-enable, or unlock triggers.
The API-side state of a trigger takes precedence over the state defined in the flow code. The state shown on this page is the authoritative source of truth for any trigger. Thus, if a trigger is marked as disabled: true in the source code but the UI toggle is on, the trigger is considered active despite being disabled in the code.
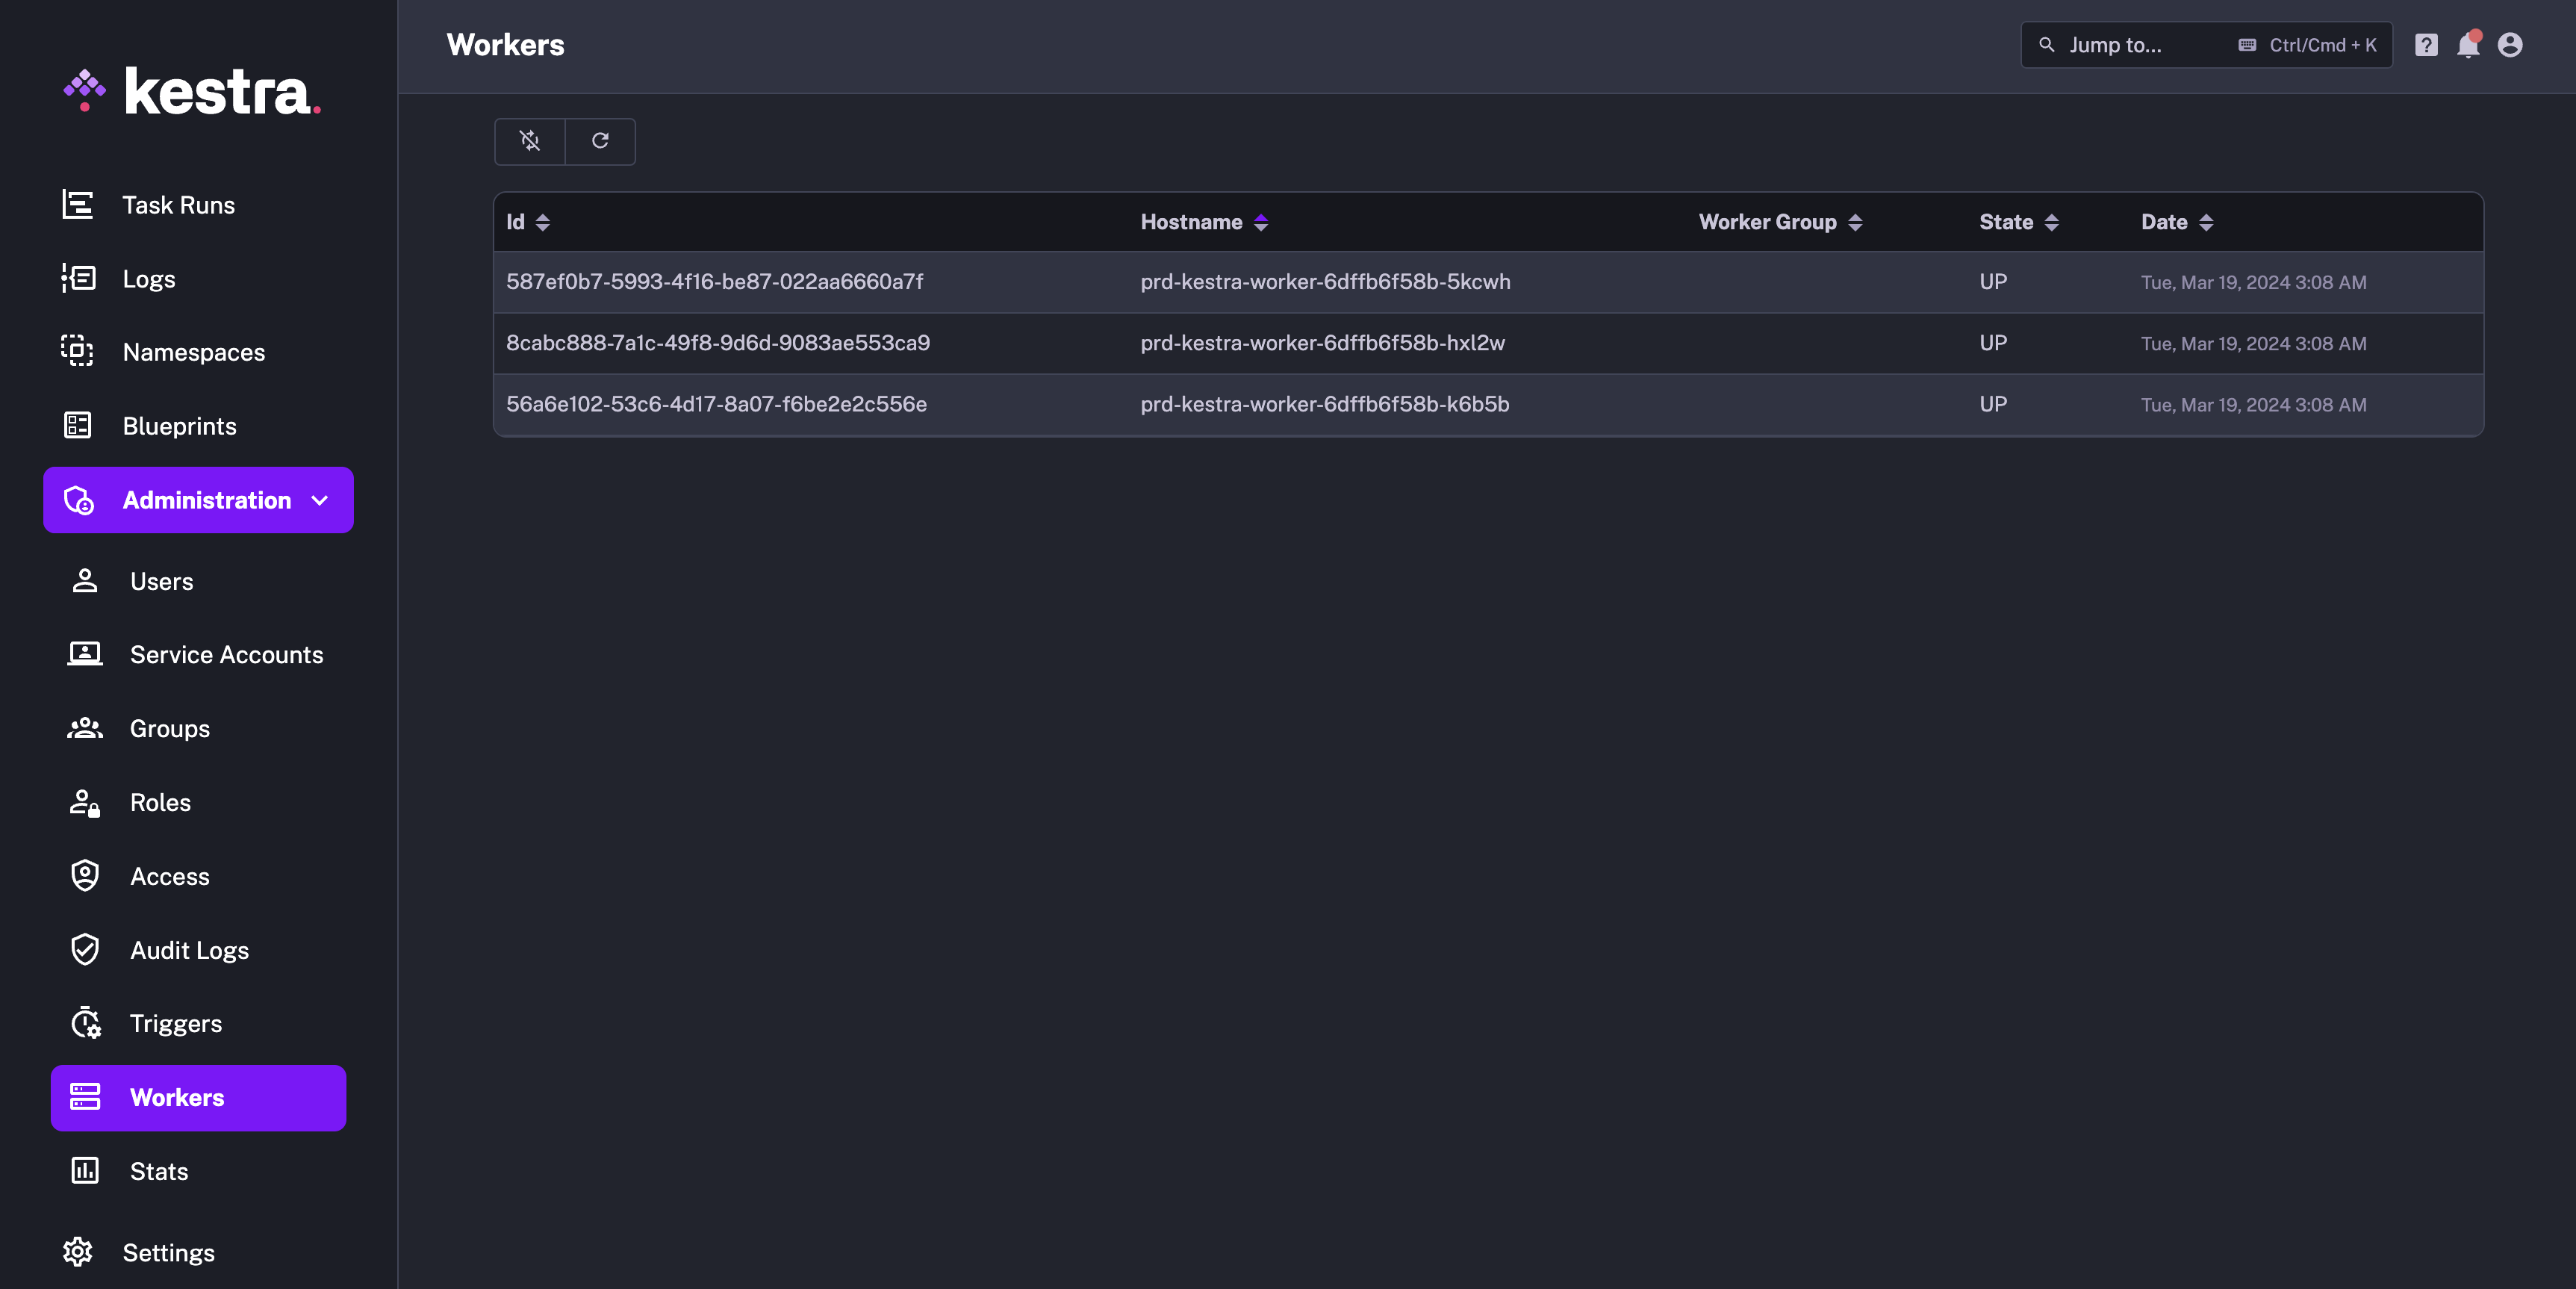
Workers
On the Workers page, you will see the list of available workers and worker groups.
Stats
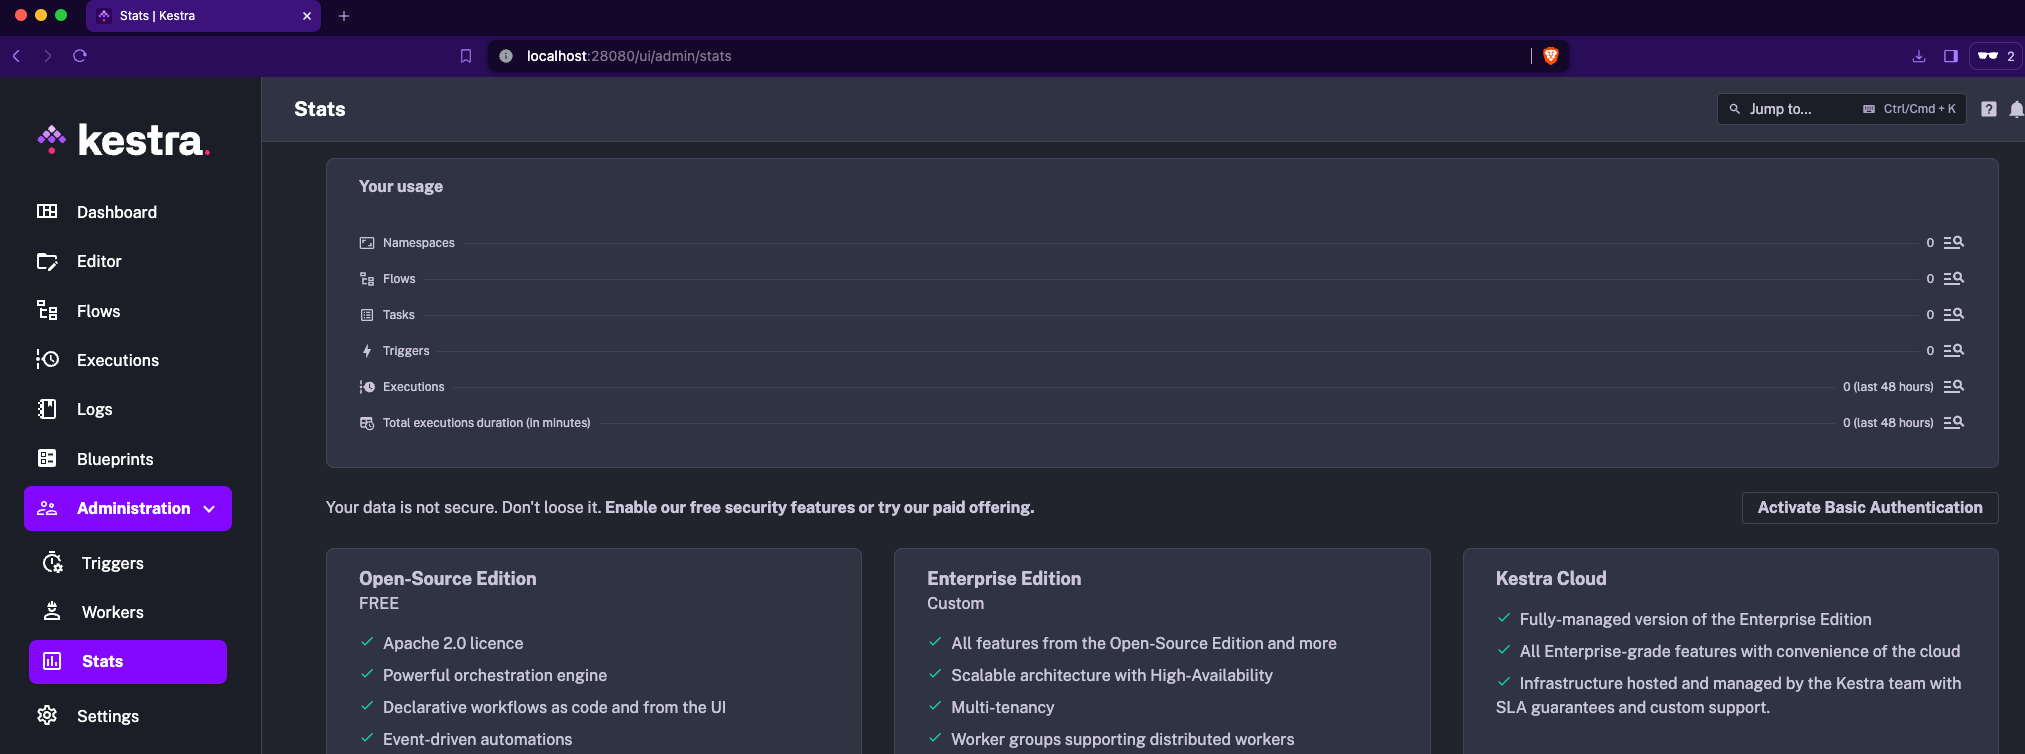
The Stats page provides a dashboard of Kestra usage statistics, including the number of namespaces, flows, tasks, triggers, executions, and the total execution duration (in minutes). In the Enterprise Edition, this page also shows the number of users, groups and roles.
The main goal of that section is to keep security in mind — you can either consider upgrading to the Enterprise Edition or activate basic authentication for a single user directly from the UI. Here is how this page looks like in the Open Source Edition:
And here is how it looks like in the Enterprise Edition:
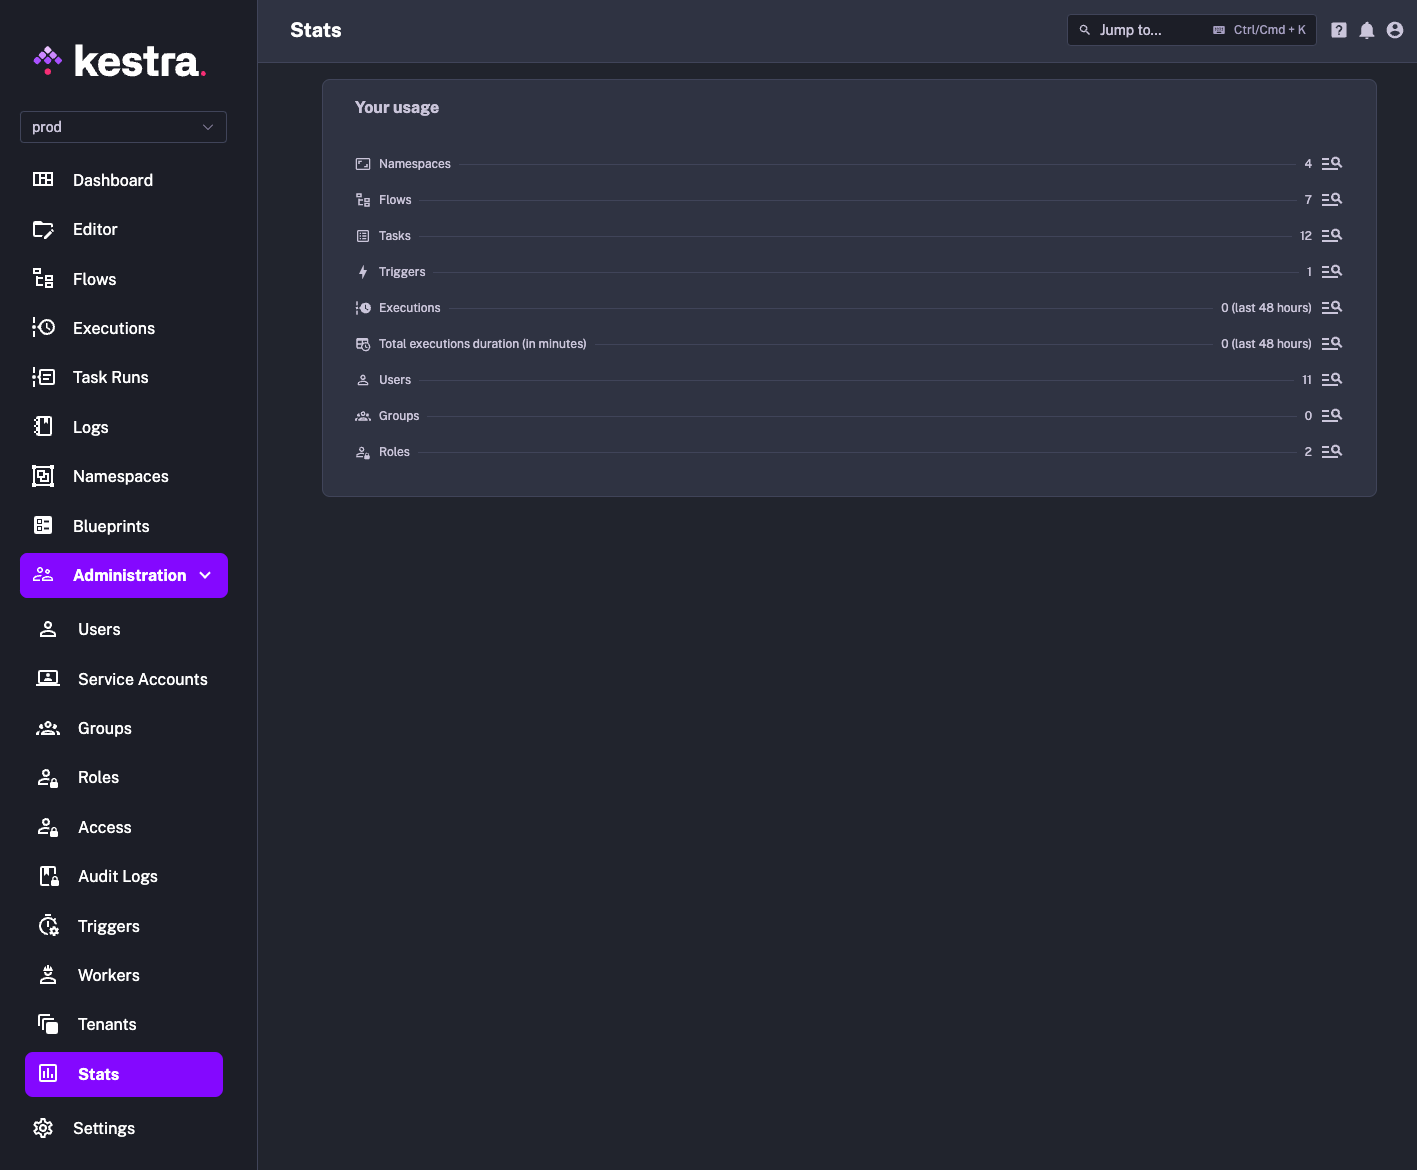
In both cases, when you click on the 🔍 magnifying glass icon, you can dive into the details of the specific stats.
Users (EE)
This feature requires a commercial license.
On the Users page, you will see the list of users.
By clicking on a user id or on the eye icon, you can open the page of a user.
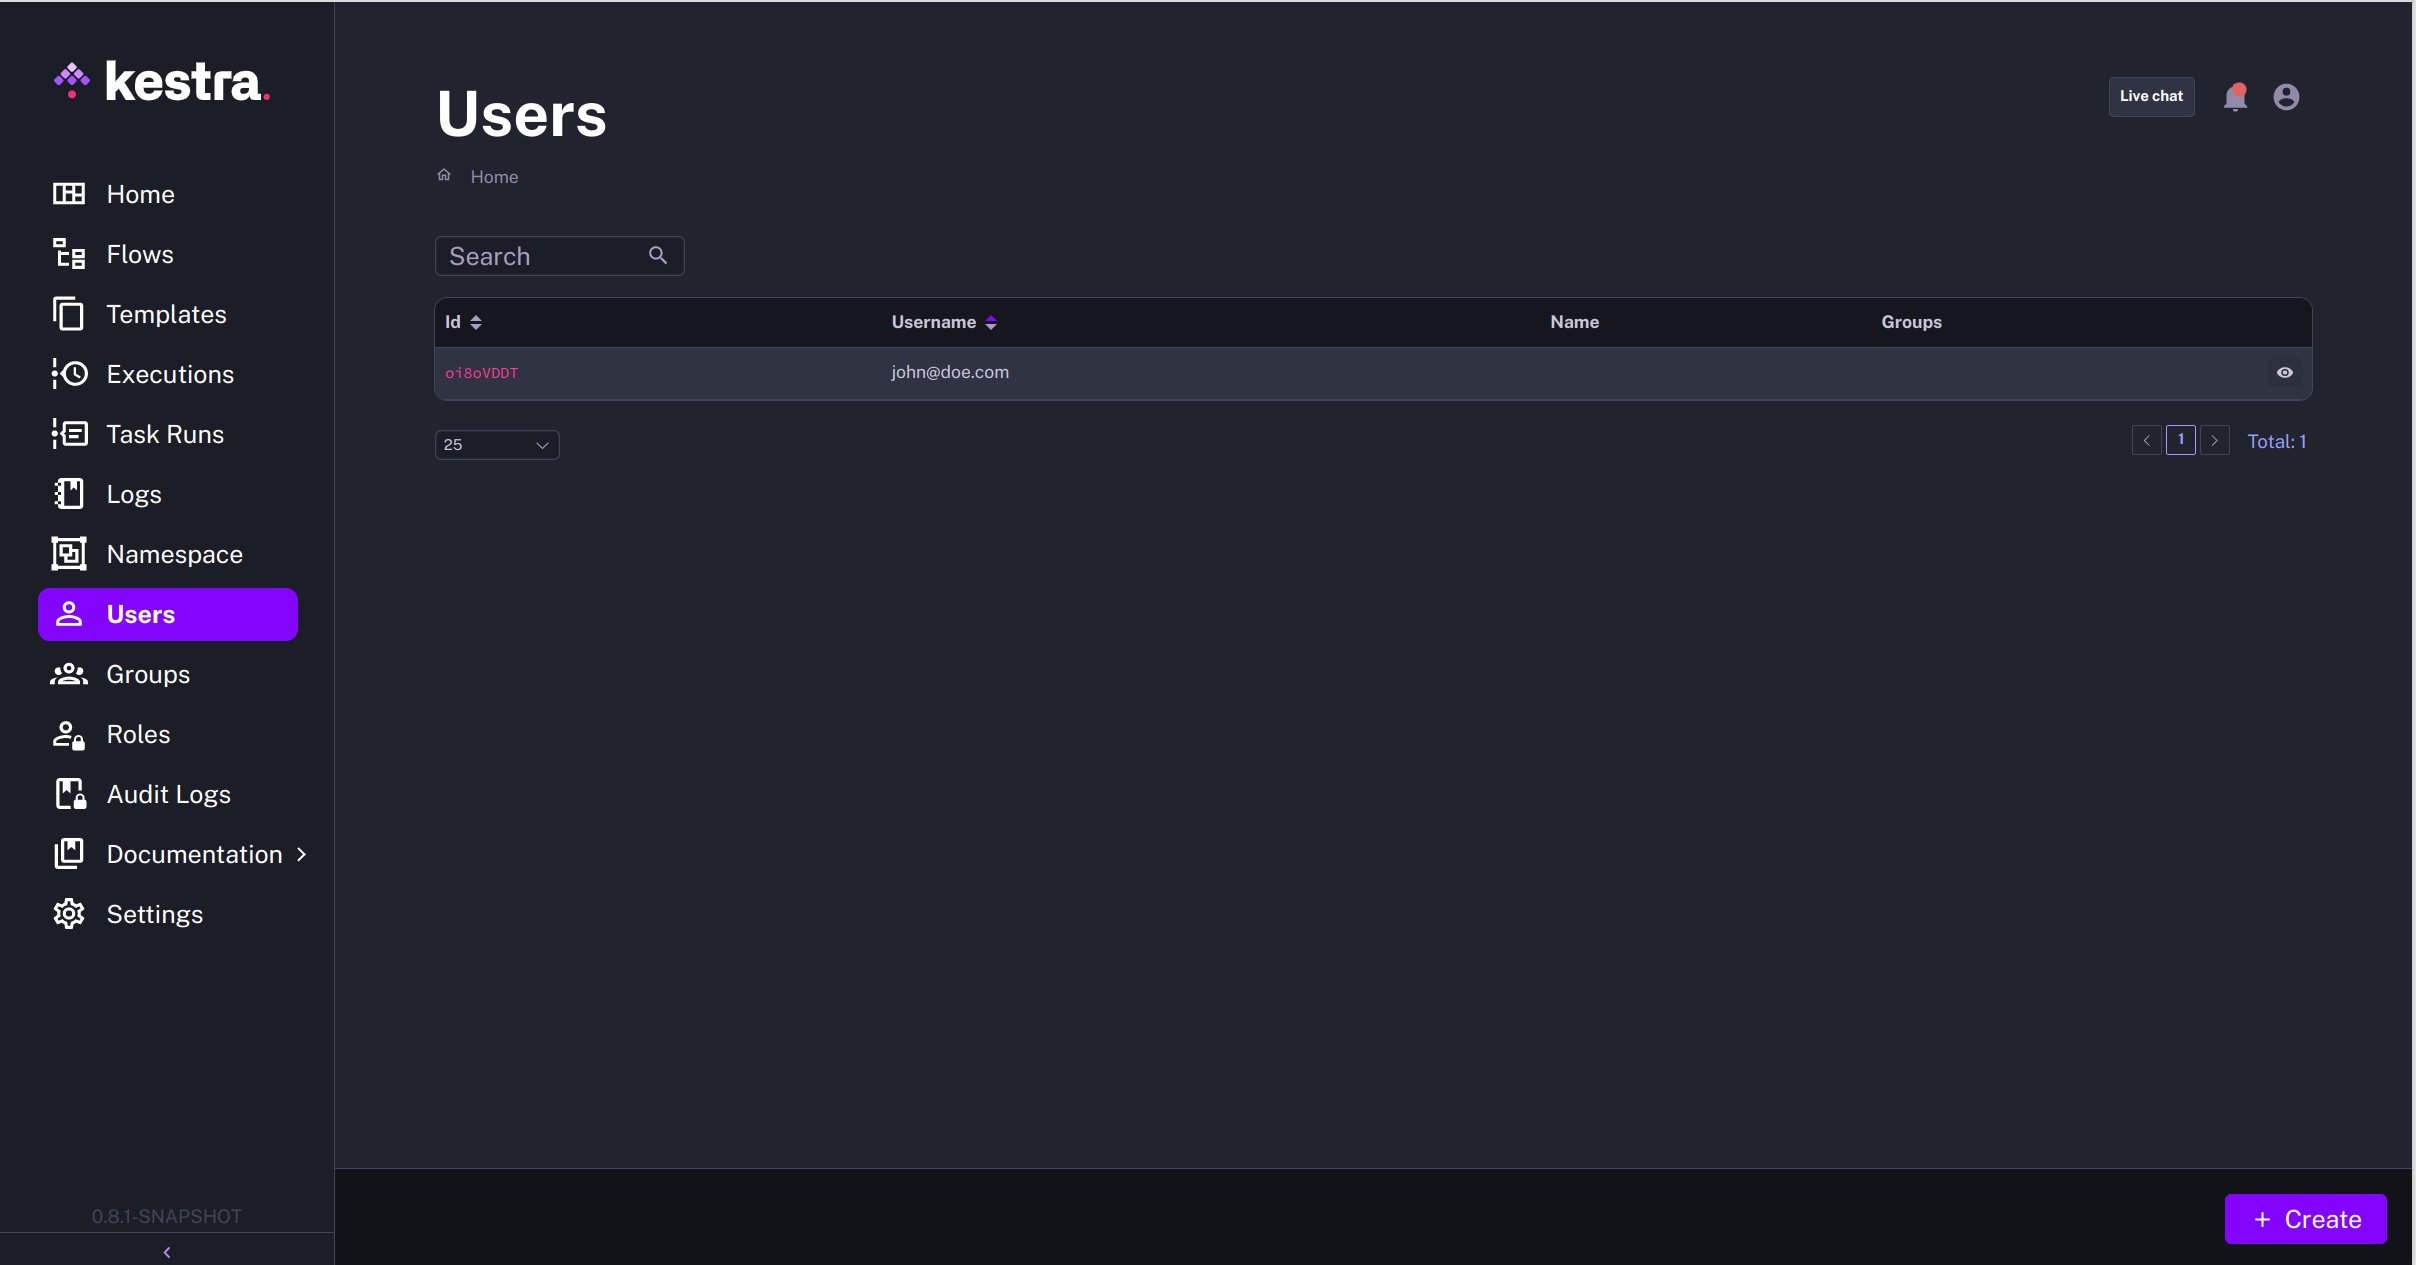
The Create button allows creating a new user and managing that user's access to Kestra.
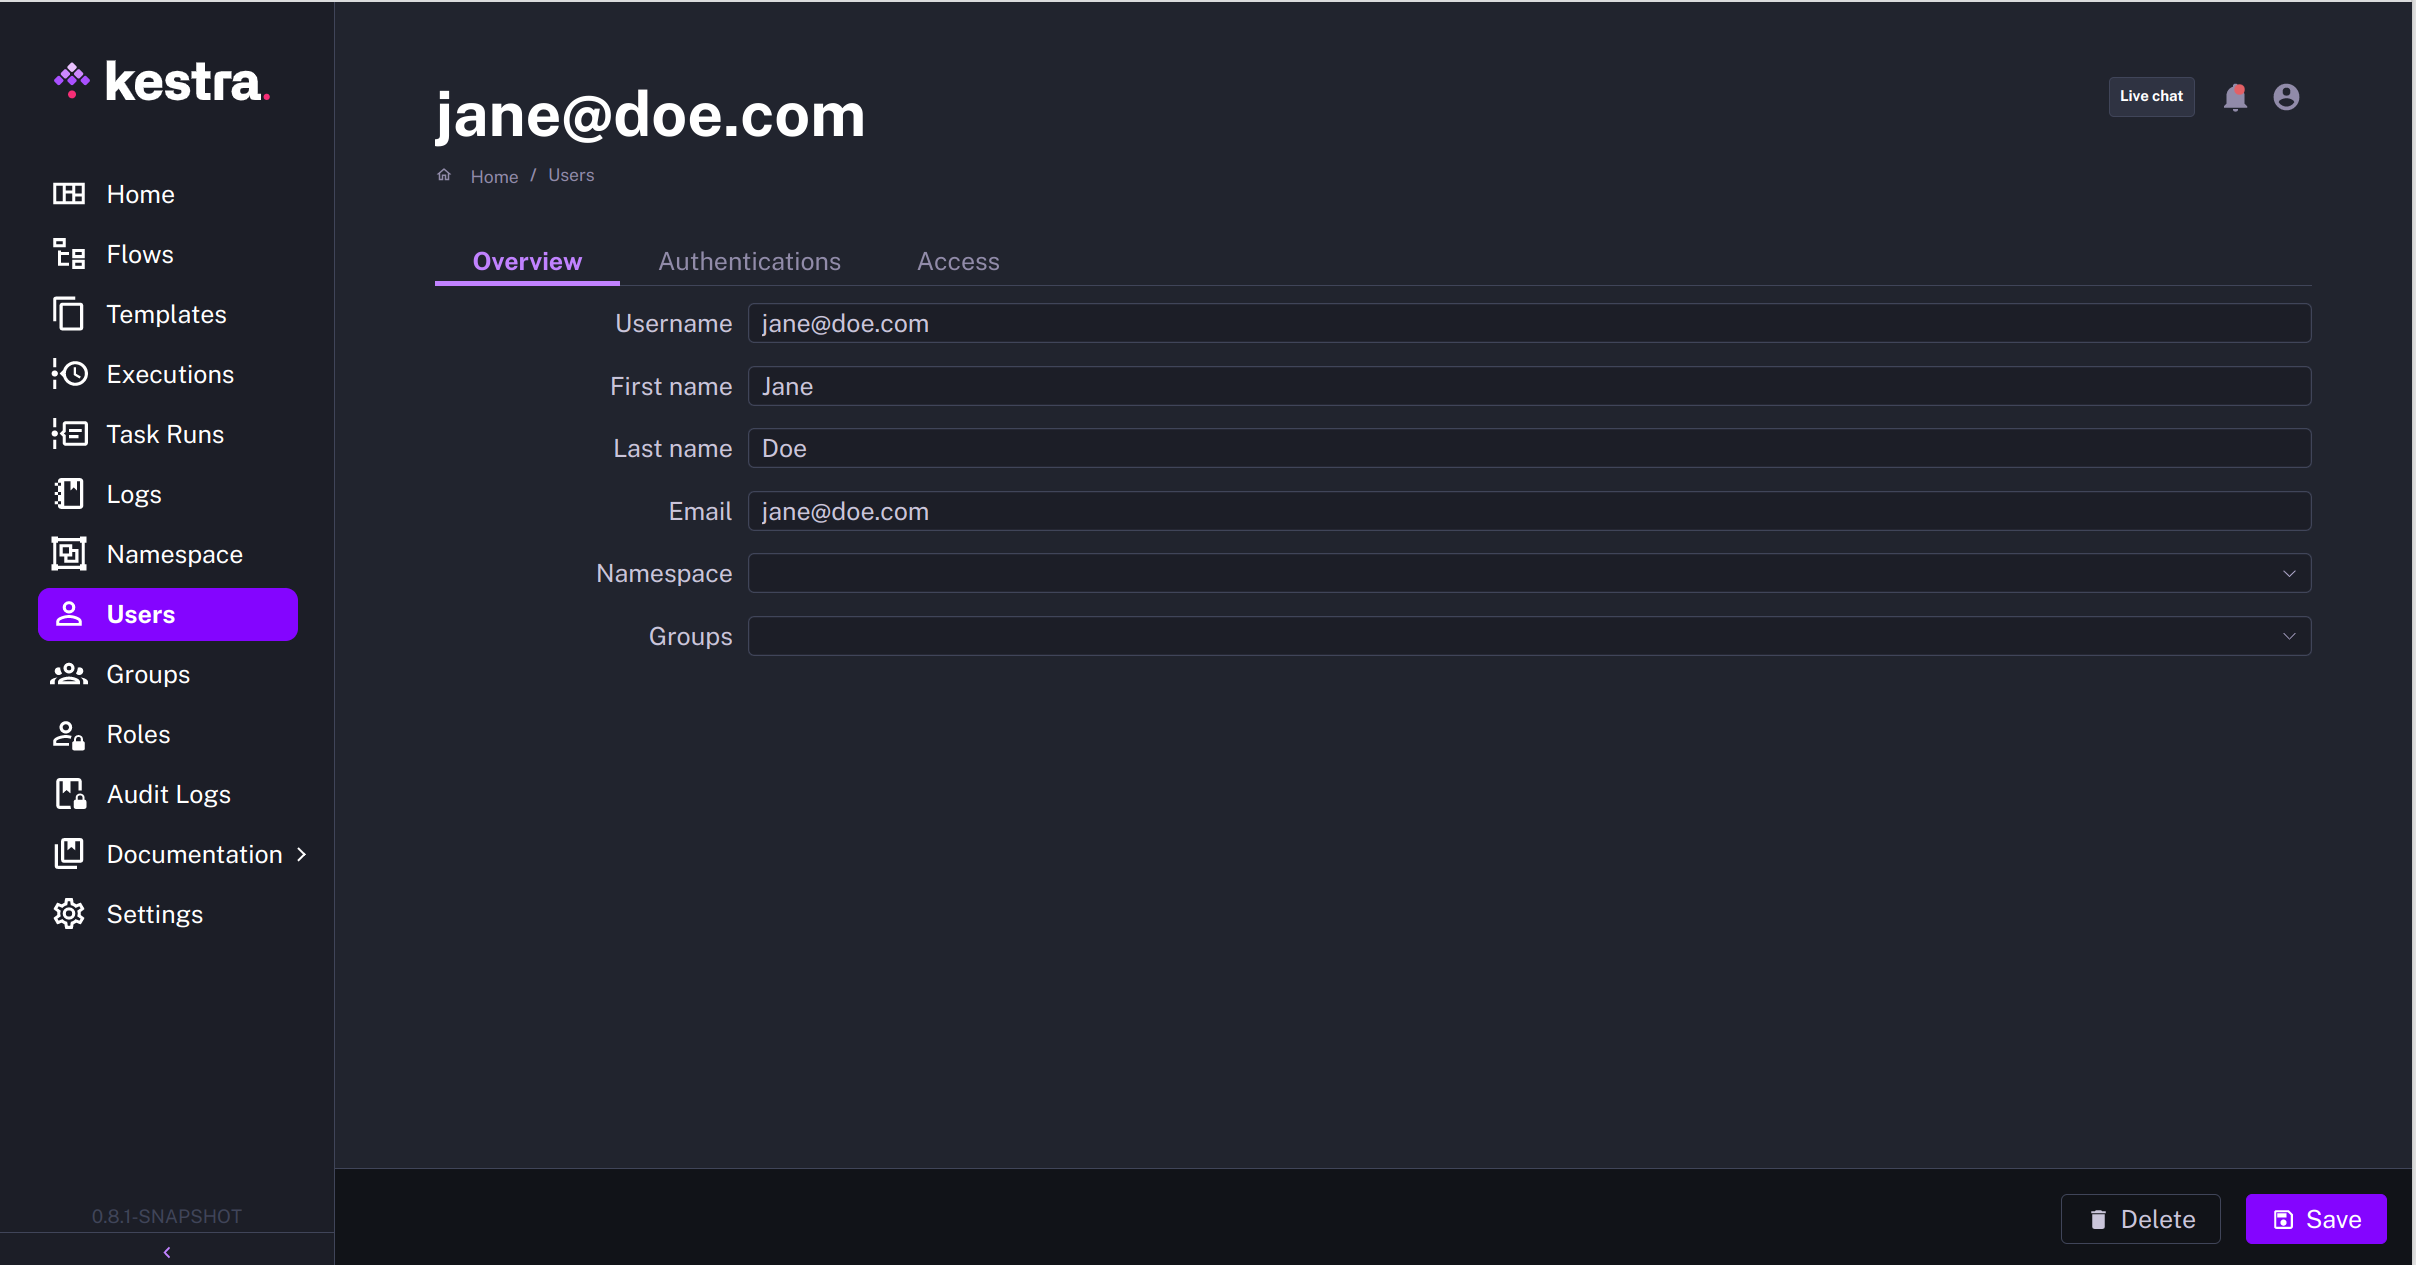
Users can be attached to Groups and/or Namespaces.
Service Accounts (EE)
To create a new service account, go to the Service Accounts page under the Administration section and click on the Create button. Fill in the form with the required information including the name and description, and click Save:
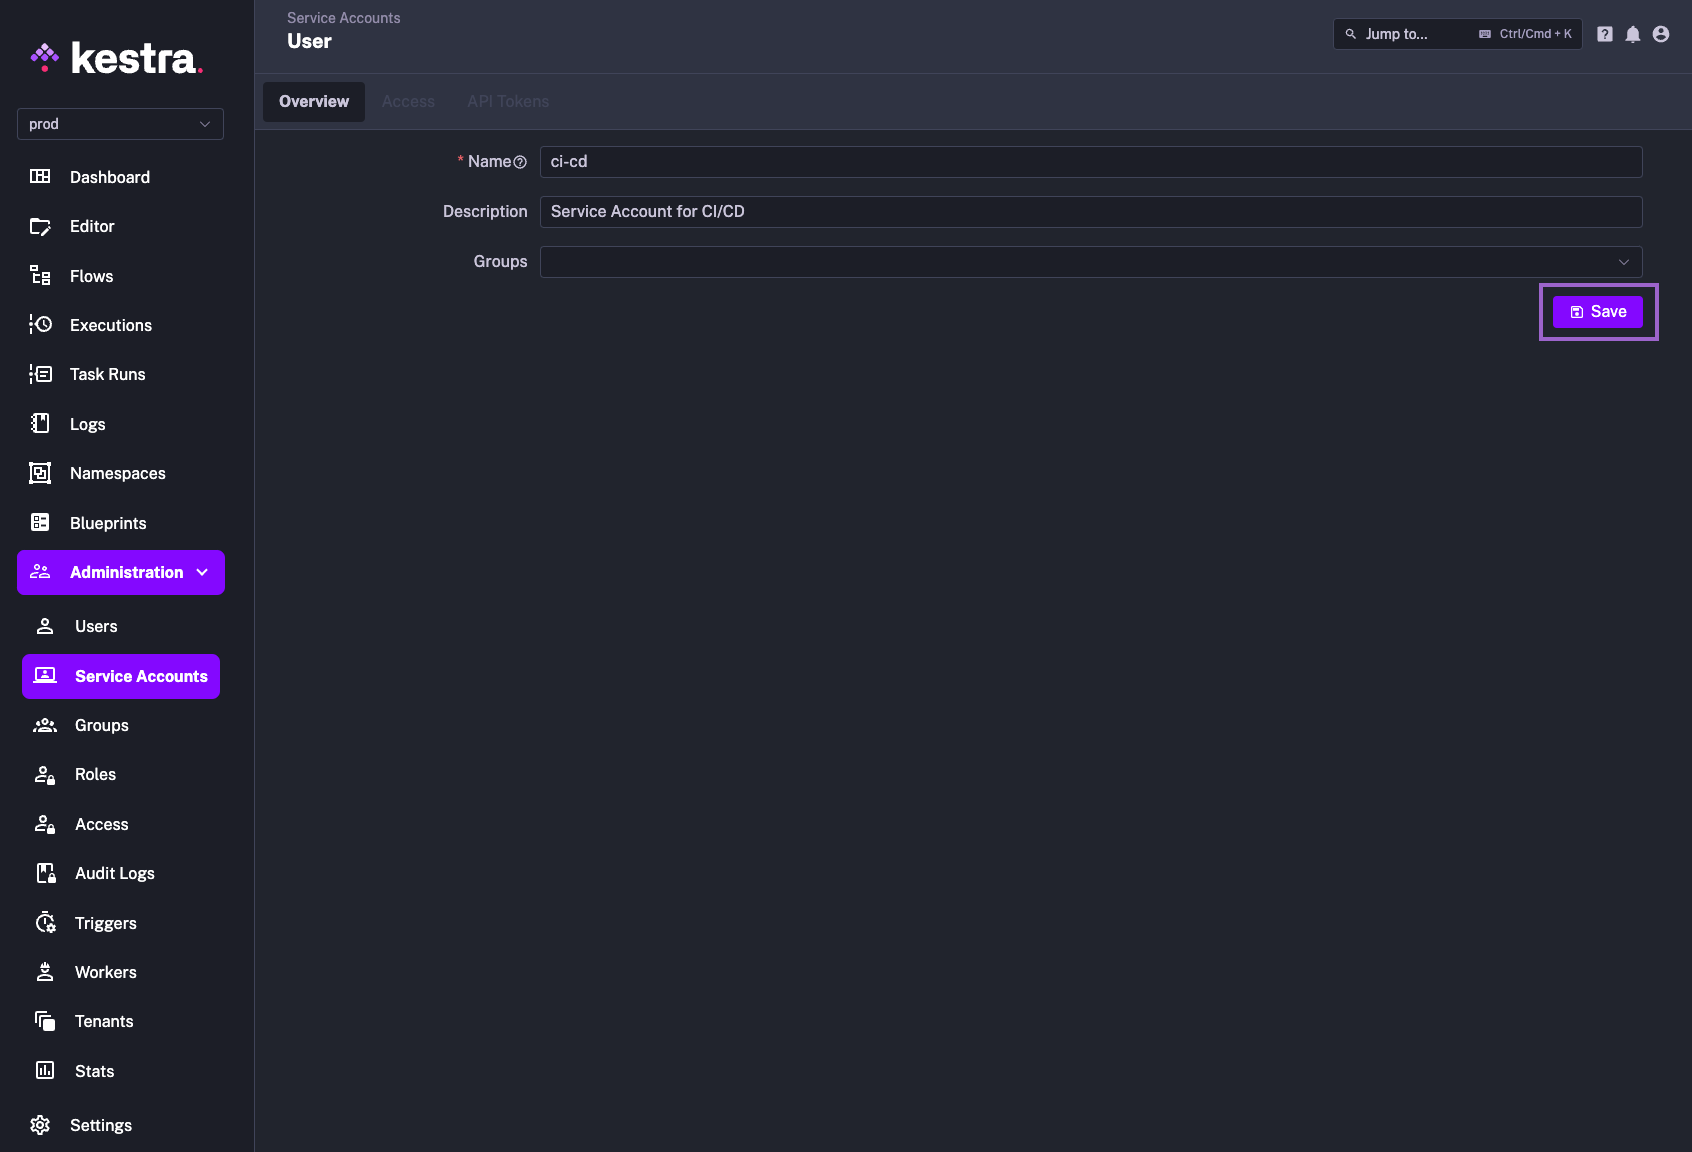
Once you have created a service account, you can add a Role that will grant the service account permissions to specific resources. To do this, click on the Add button and select the role you want to assign to the service account.

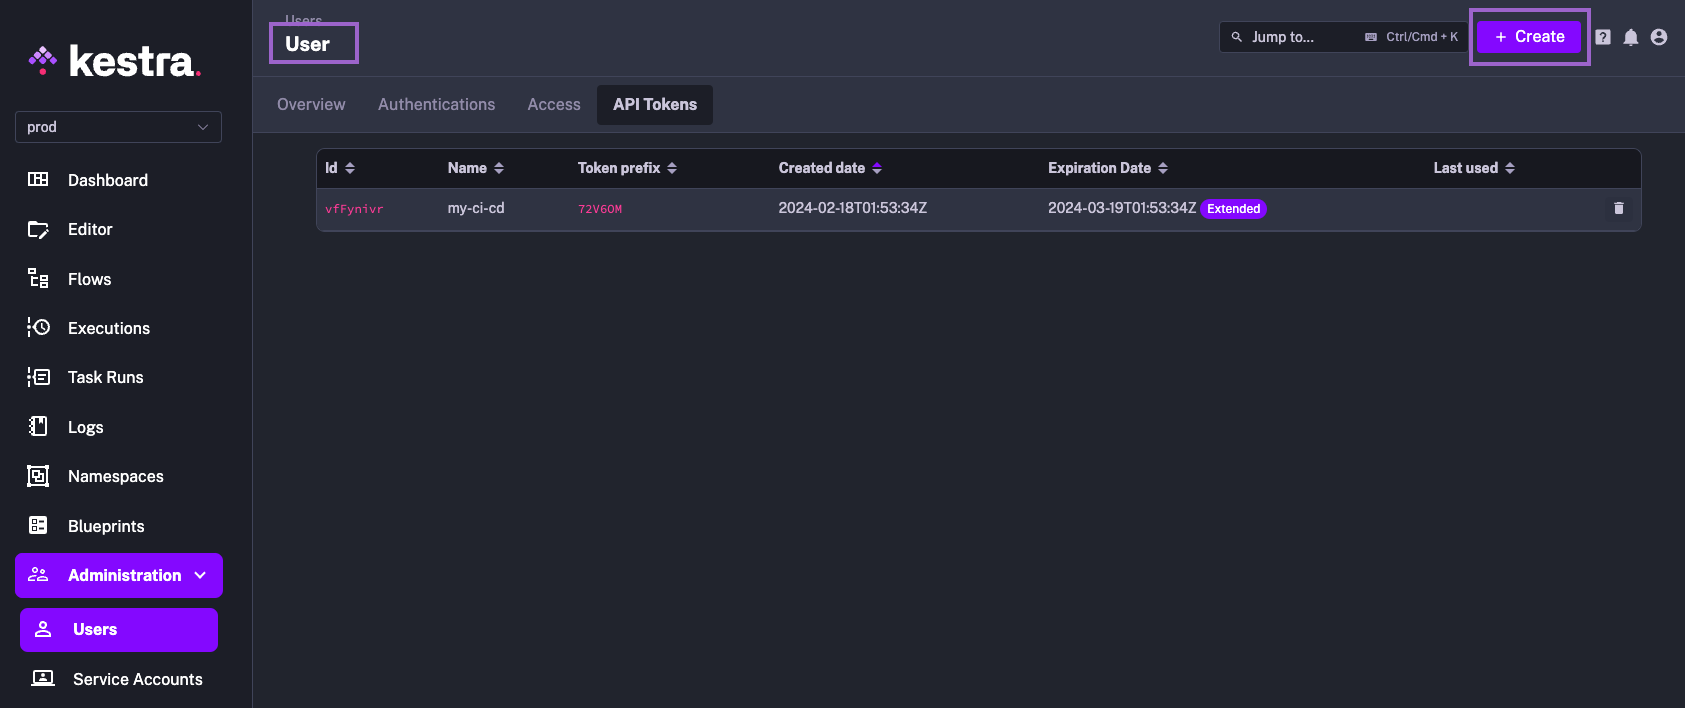
Finally, you can generate an API token for the service account by clicking on the Create button. This will generate a token that you can use to authenticate the service account with Kestra from external applications such as CI/CD pipelines (e.g. in Terraform provider configuration or GitHub Actions secrets).

Note how you can configure the token to expire after a certain period of time, or to never expire. Also, there is a toggle called Extended that will automatically prolong the token's expiration date by the specified number of days (Max Age) if the token is actively used. That toggle is disabled by default.
Once you confirm the API token creation via the Generate button, the token will be generated and displayed in the UI. Make sure to copy the token and store it in a secure location as it will not be displayed again.
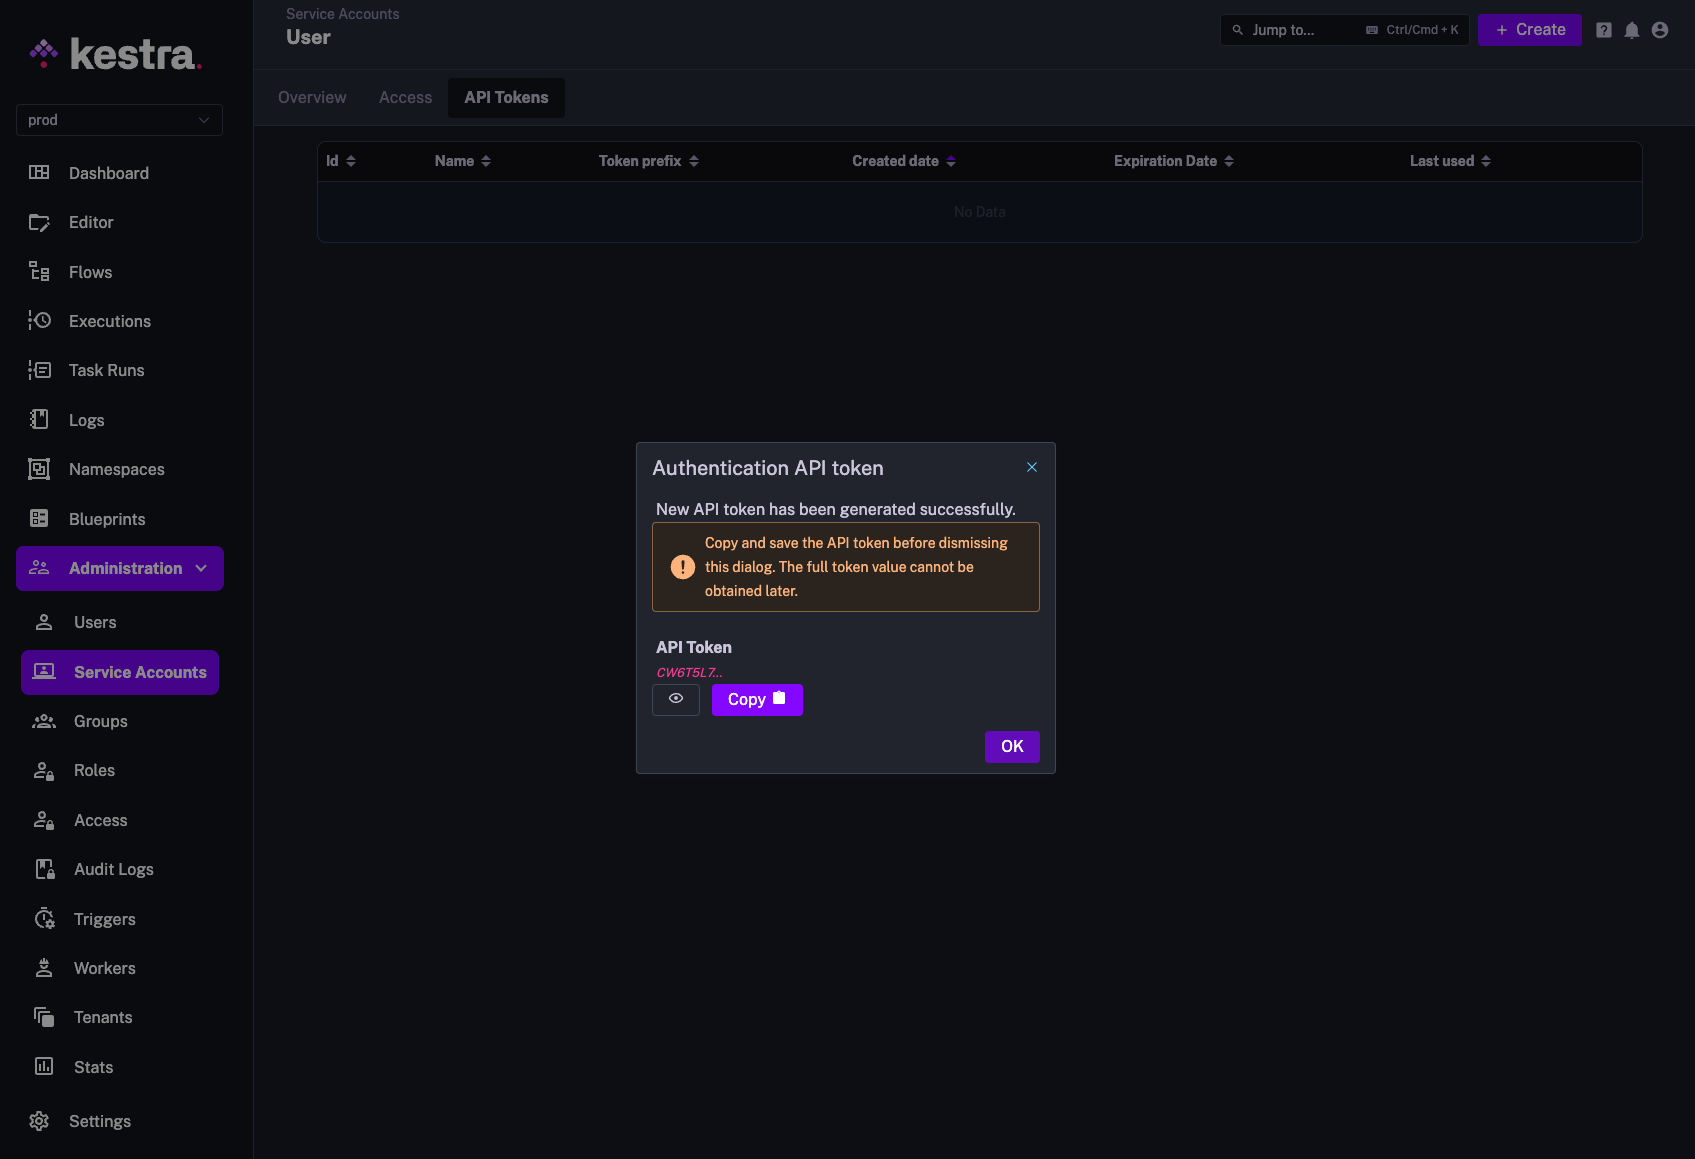
Note that you can create an API token also as a regular User. While Service Accounts are generally recommended for programmatic API access to Kestra from CI/CD or other external applications, often it's useful to create an API token for a regular user, so that programmatic actions performed by that user can be tracked and audited.
Groups (EE)
This feature requires a commercial license.
On the Groups page, you will see the list of groups.
By clicking on a group id or on the eye icon, you can open the page of a group.
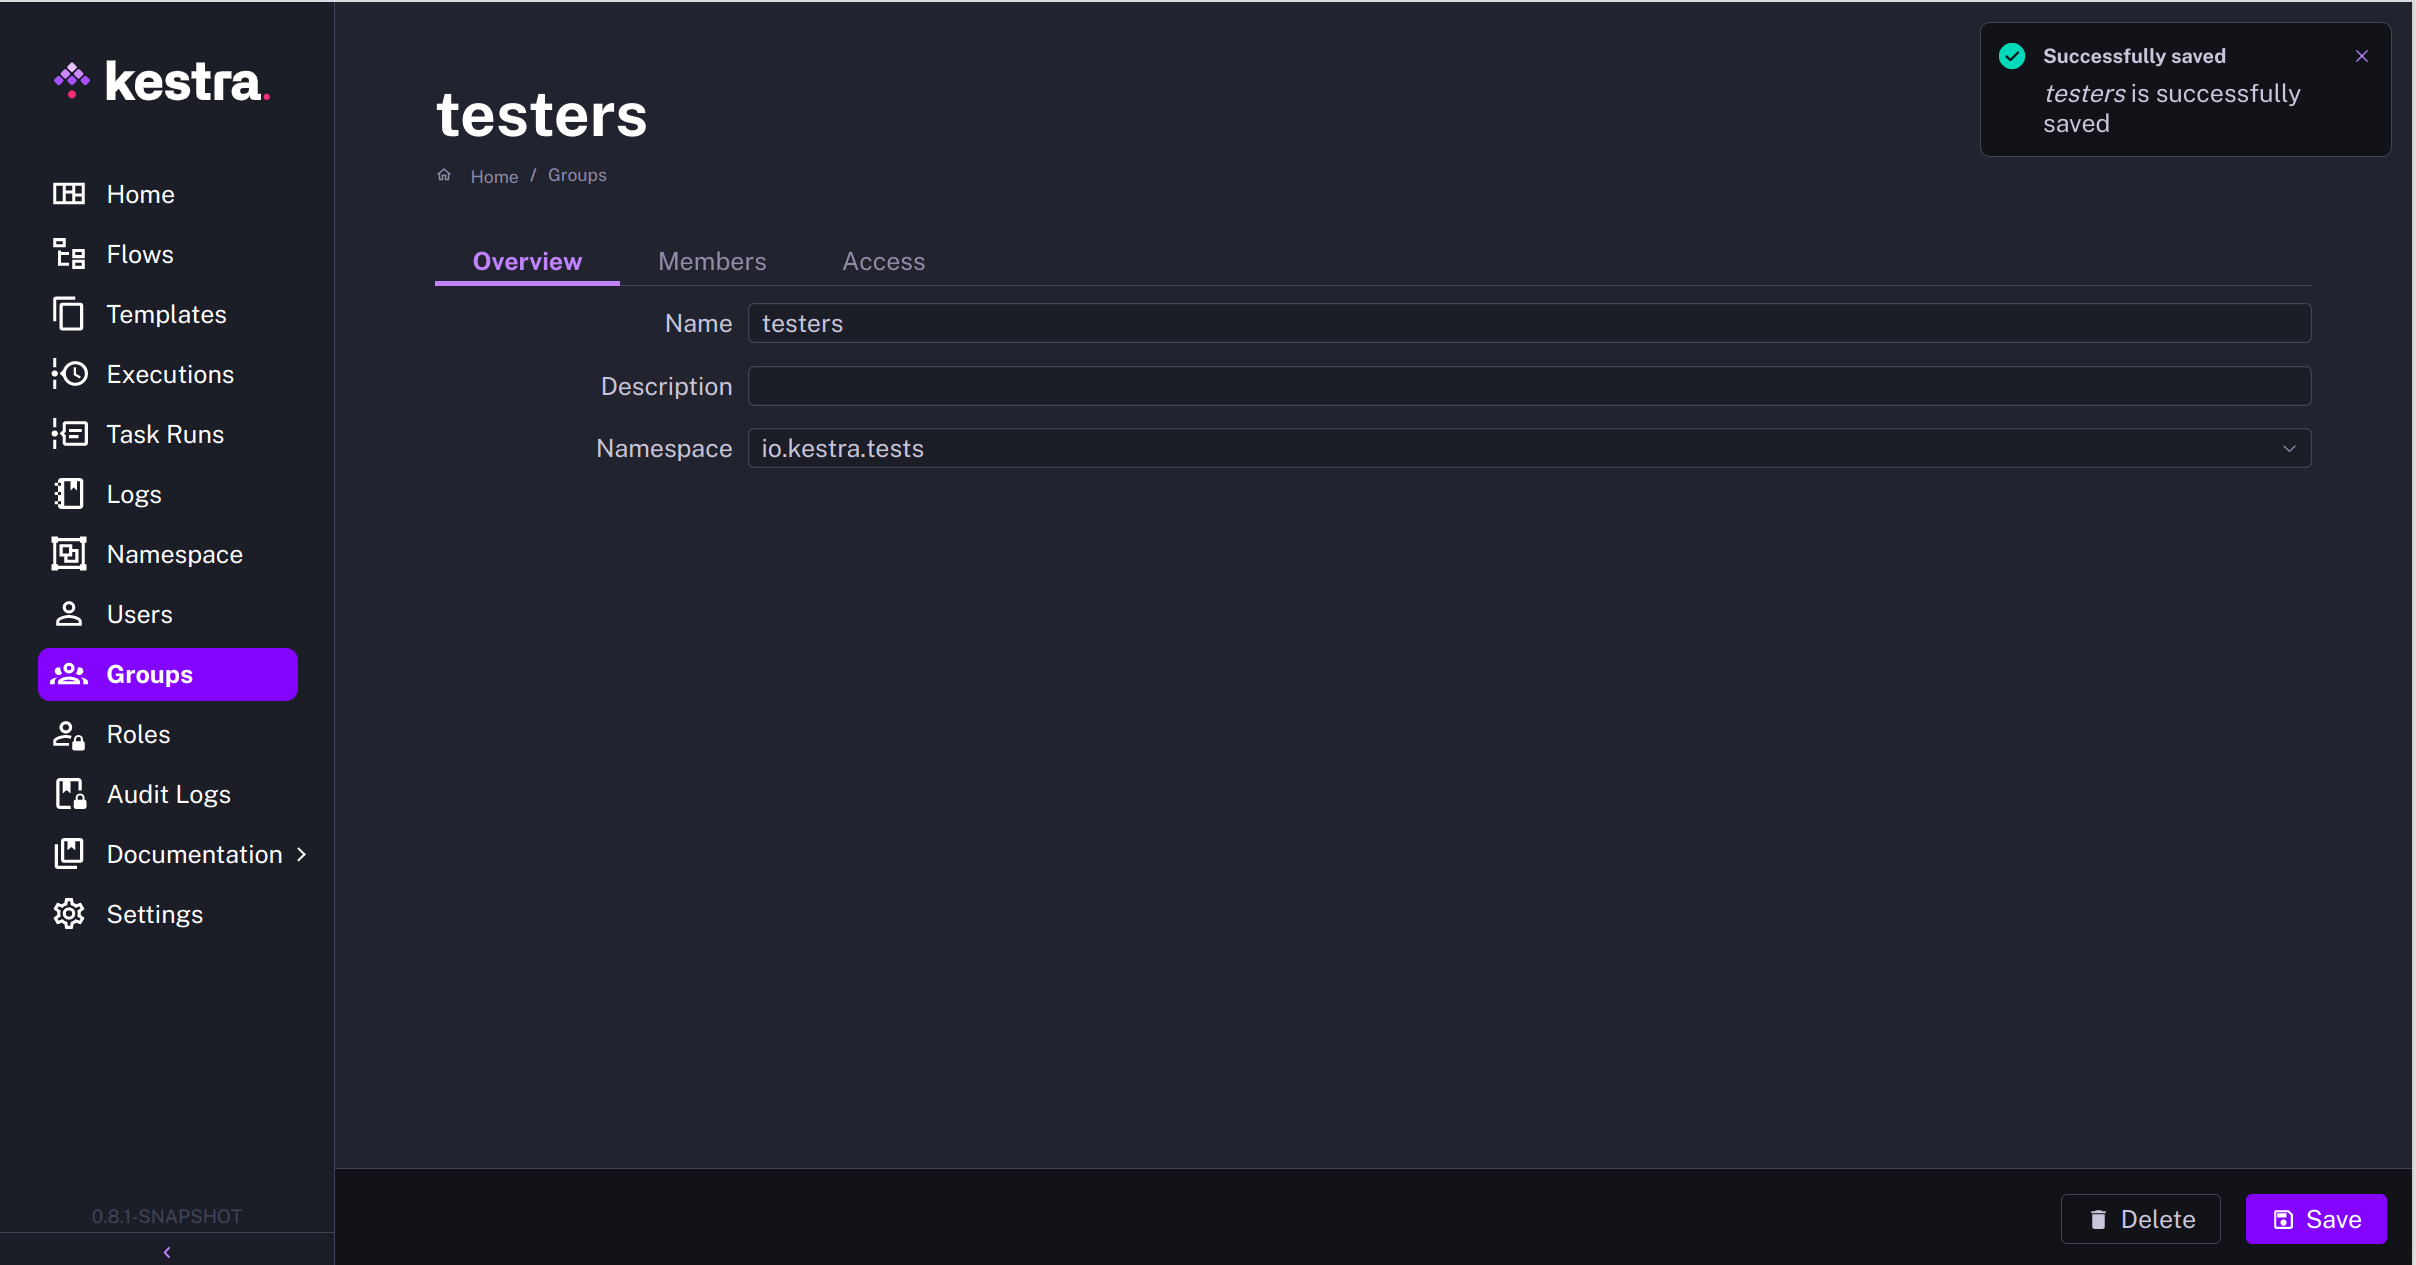
The Create button allows creating a new group and managing its access to Kestra.
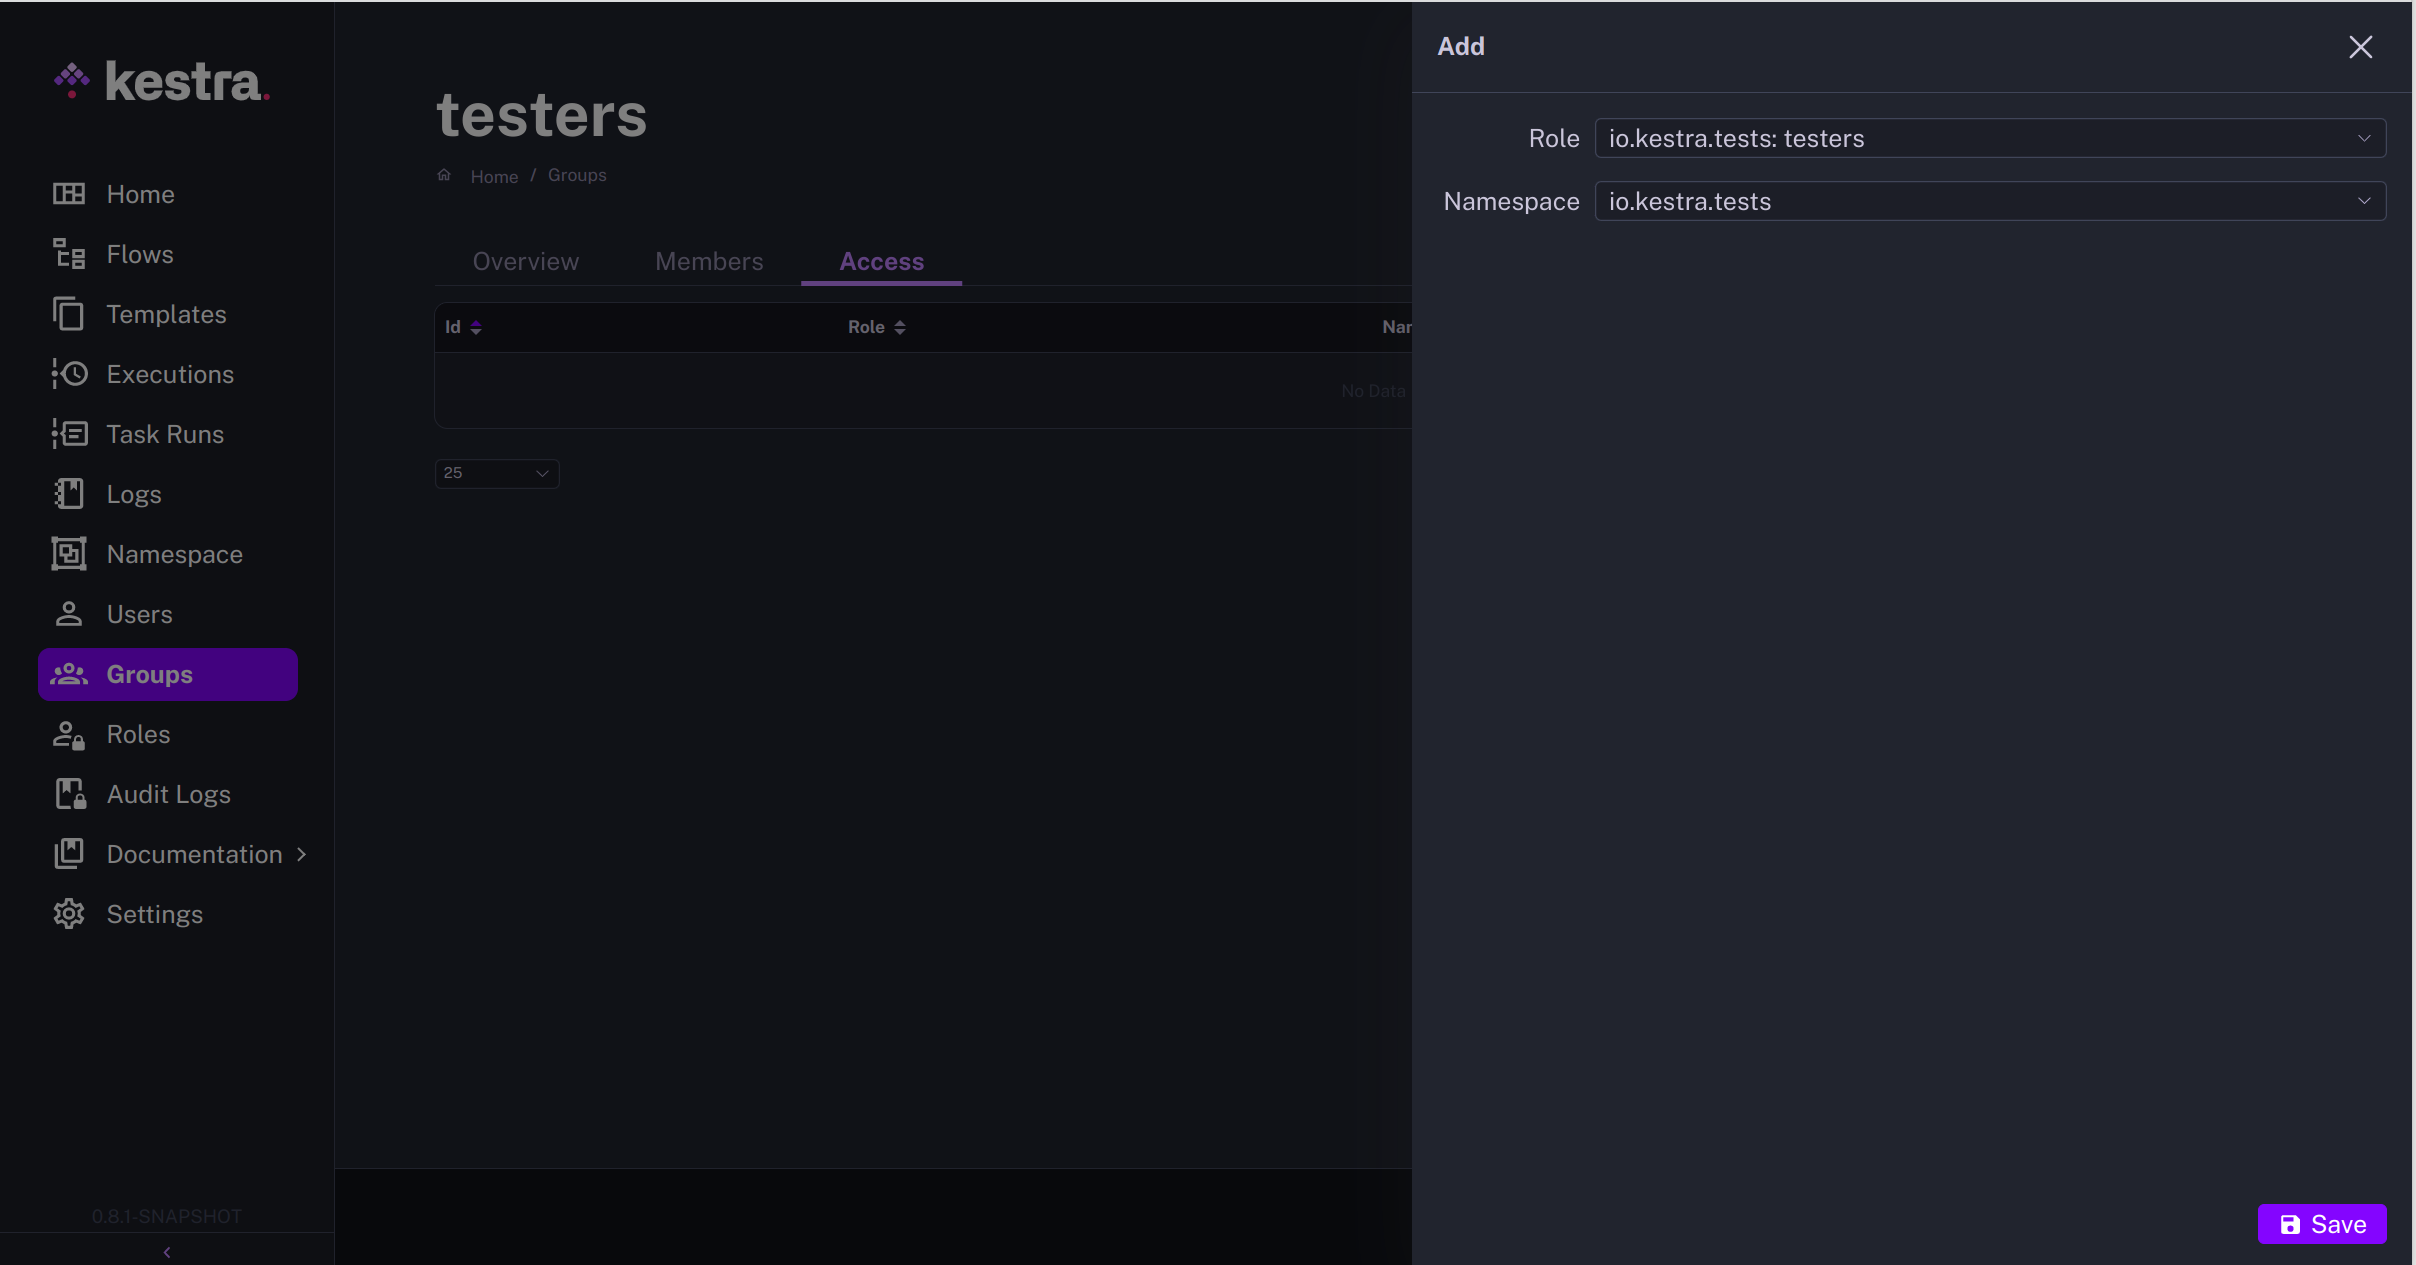
It's a collection of users who require the same set of permissions. It's useful to assign the same permissions to multiple users who belong to the same team or project.
Roles (EE)
This feature requires a commercial license.
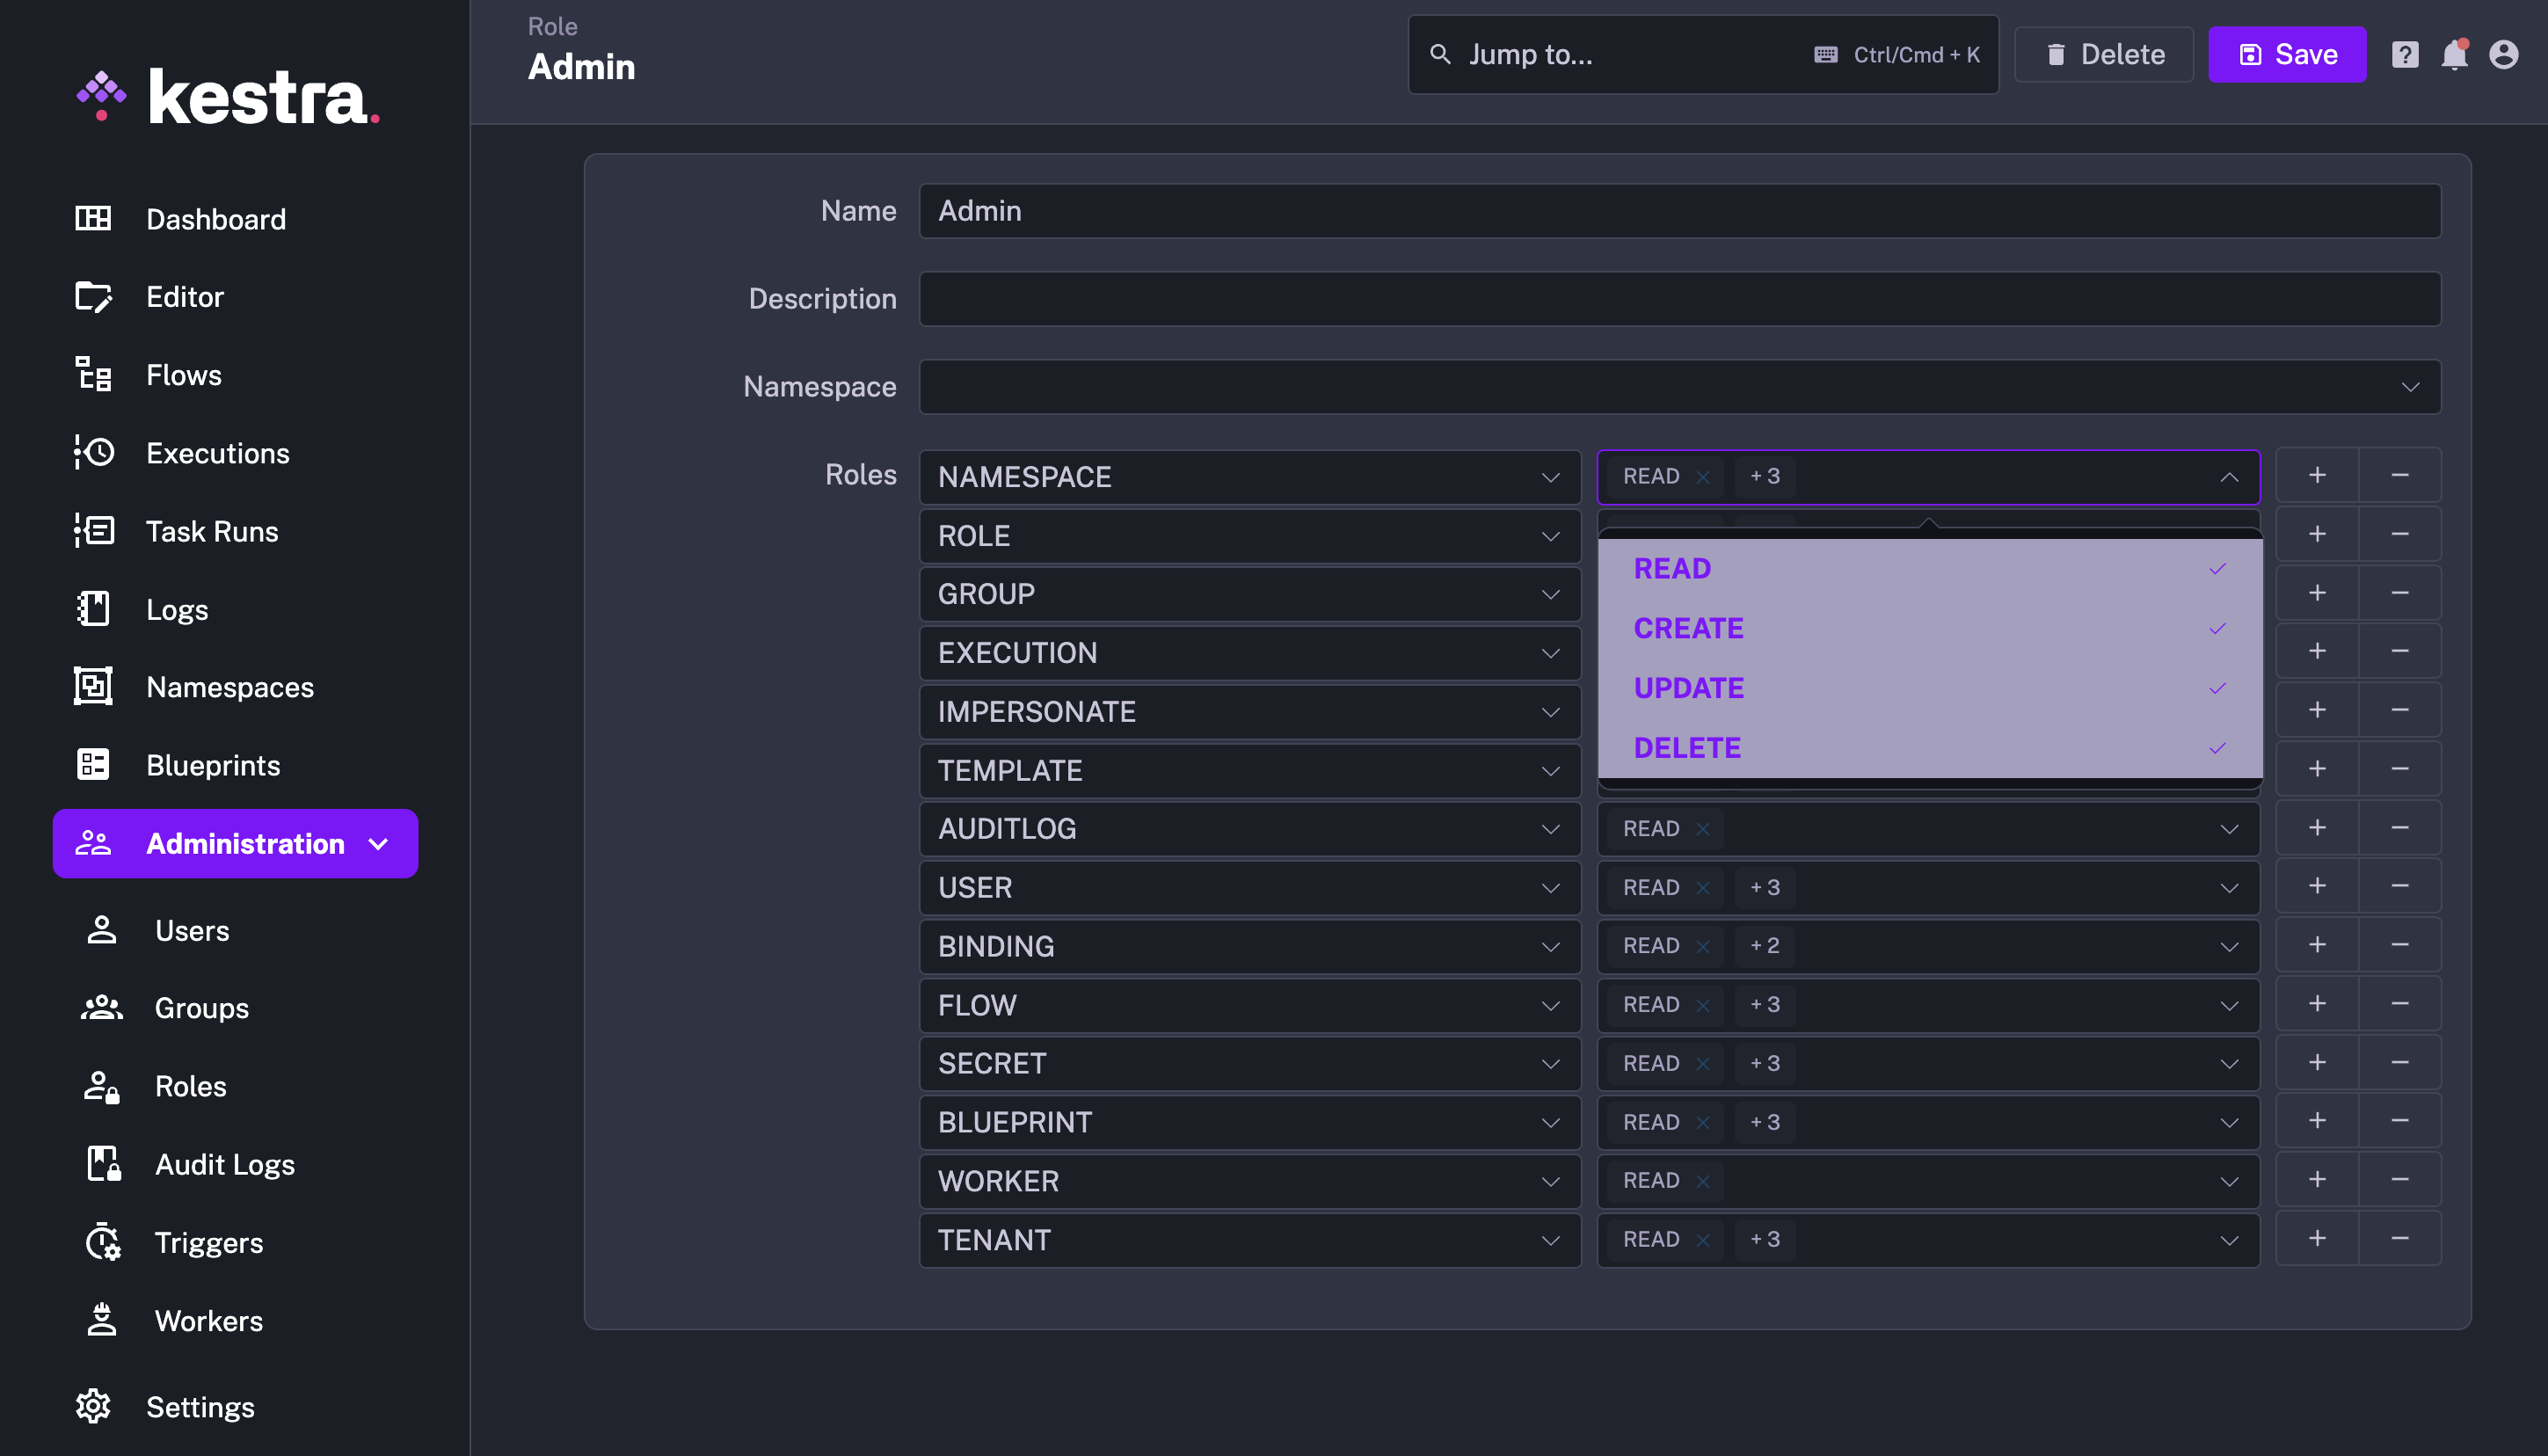
On the Roles page, you will see the list of roles.
By clicking on a role id or on the eye icon, you can open the page of a role.
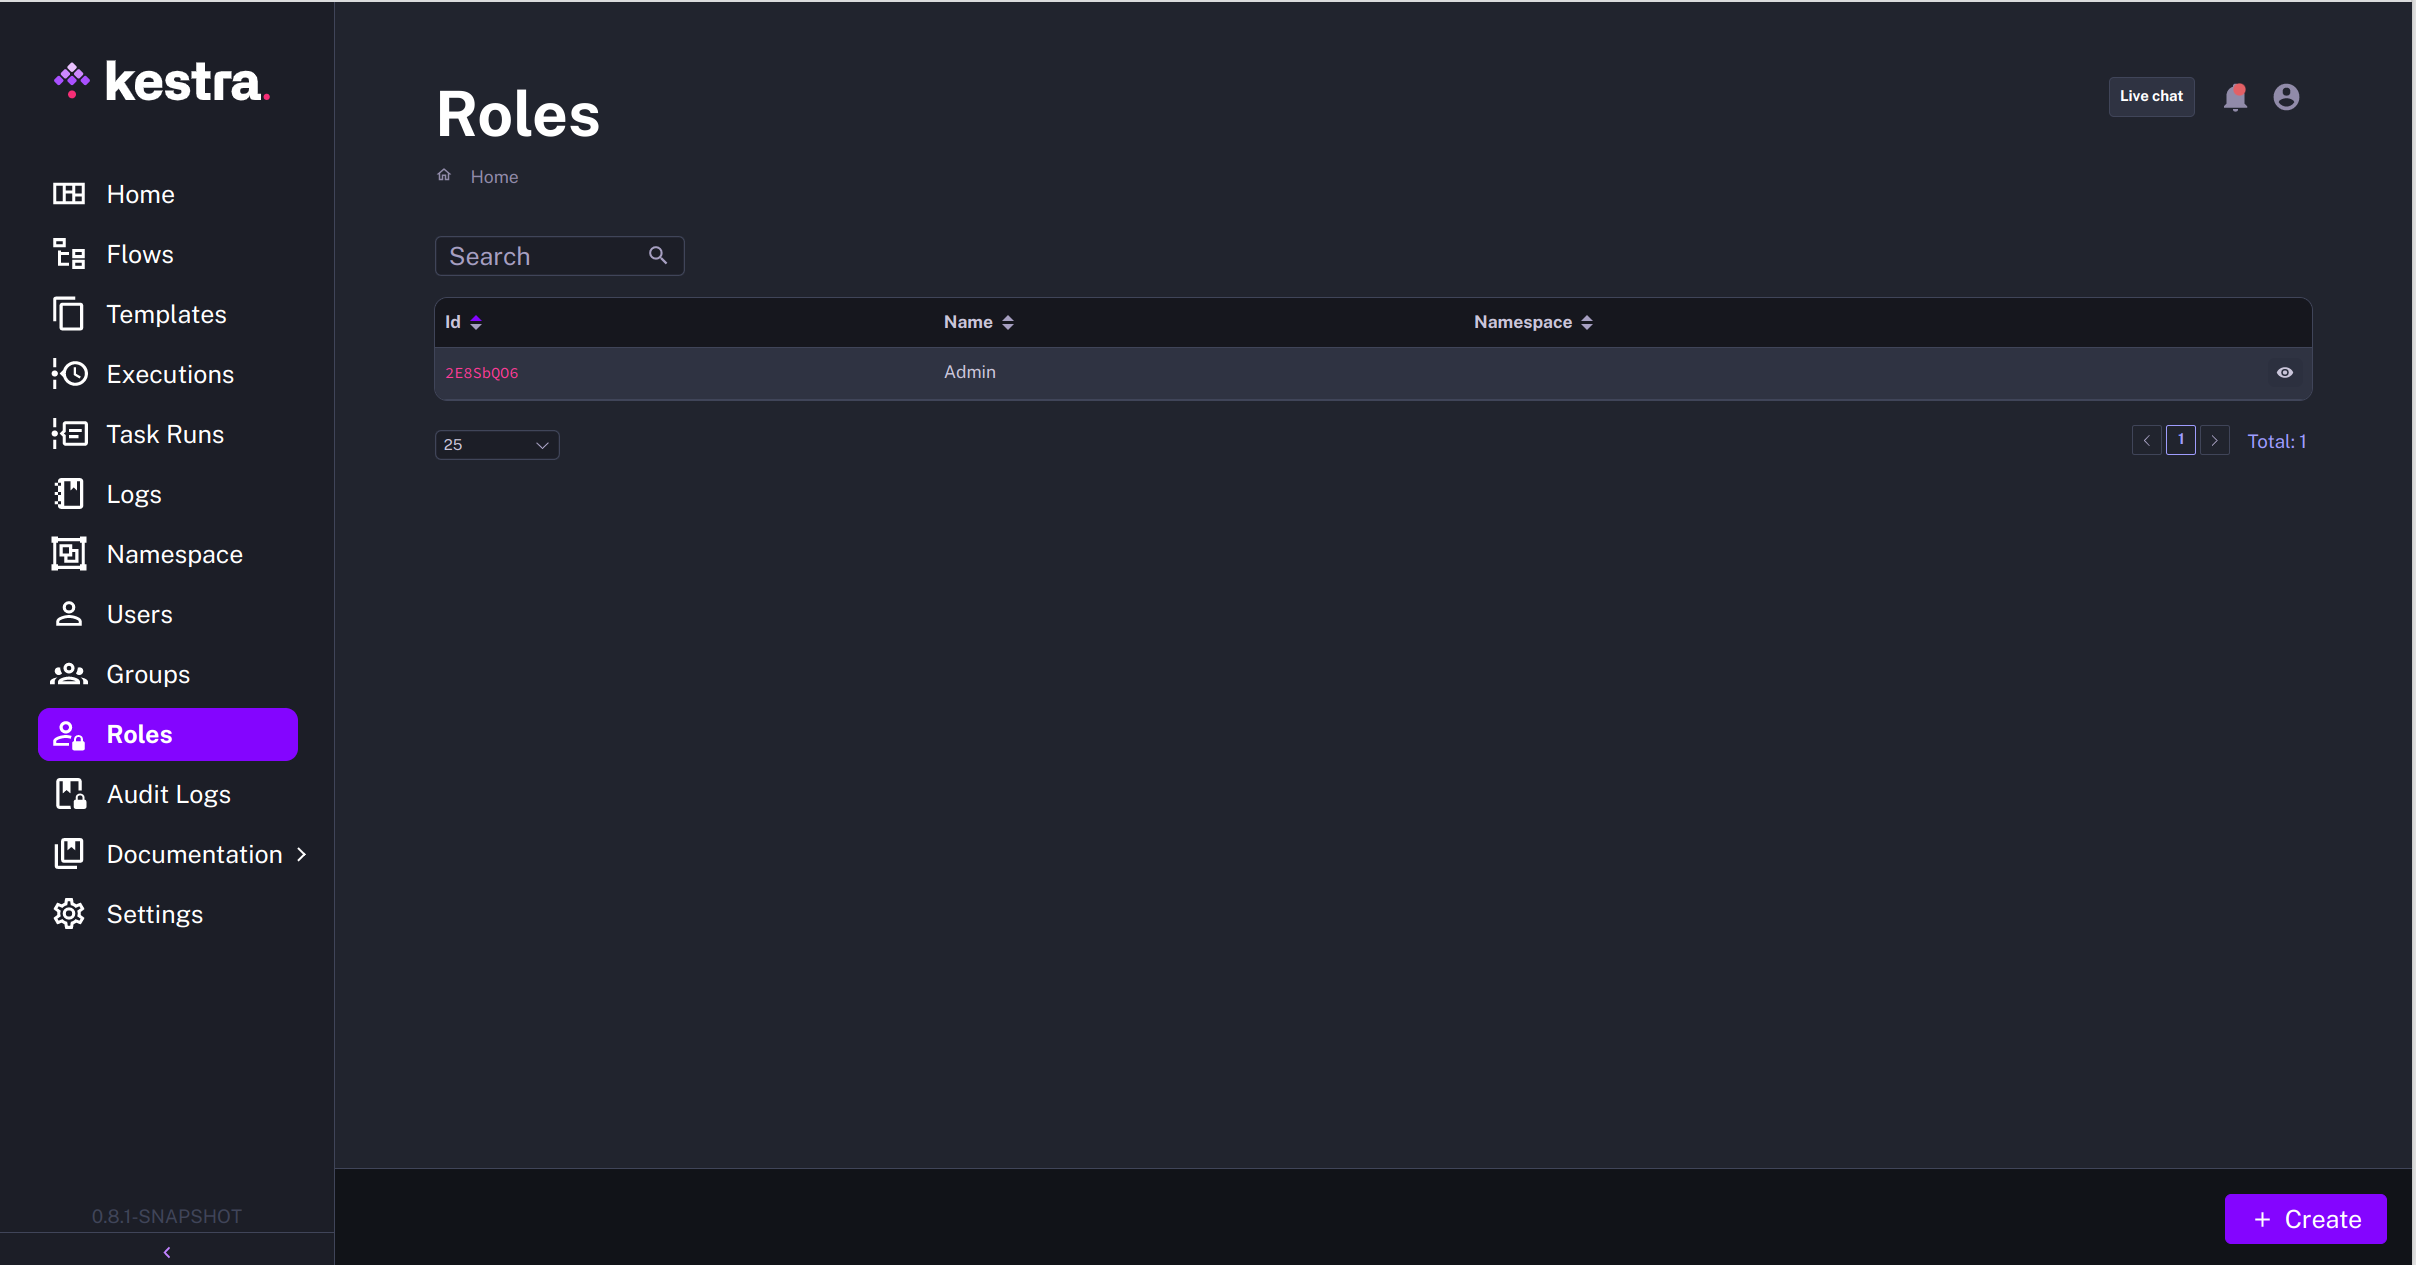
The Create button allows creating a new role.
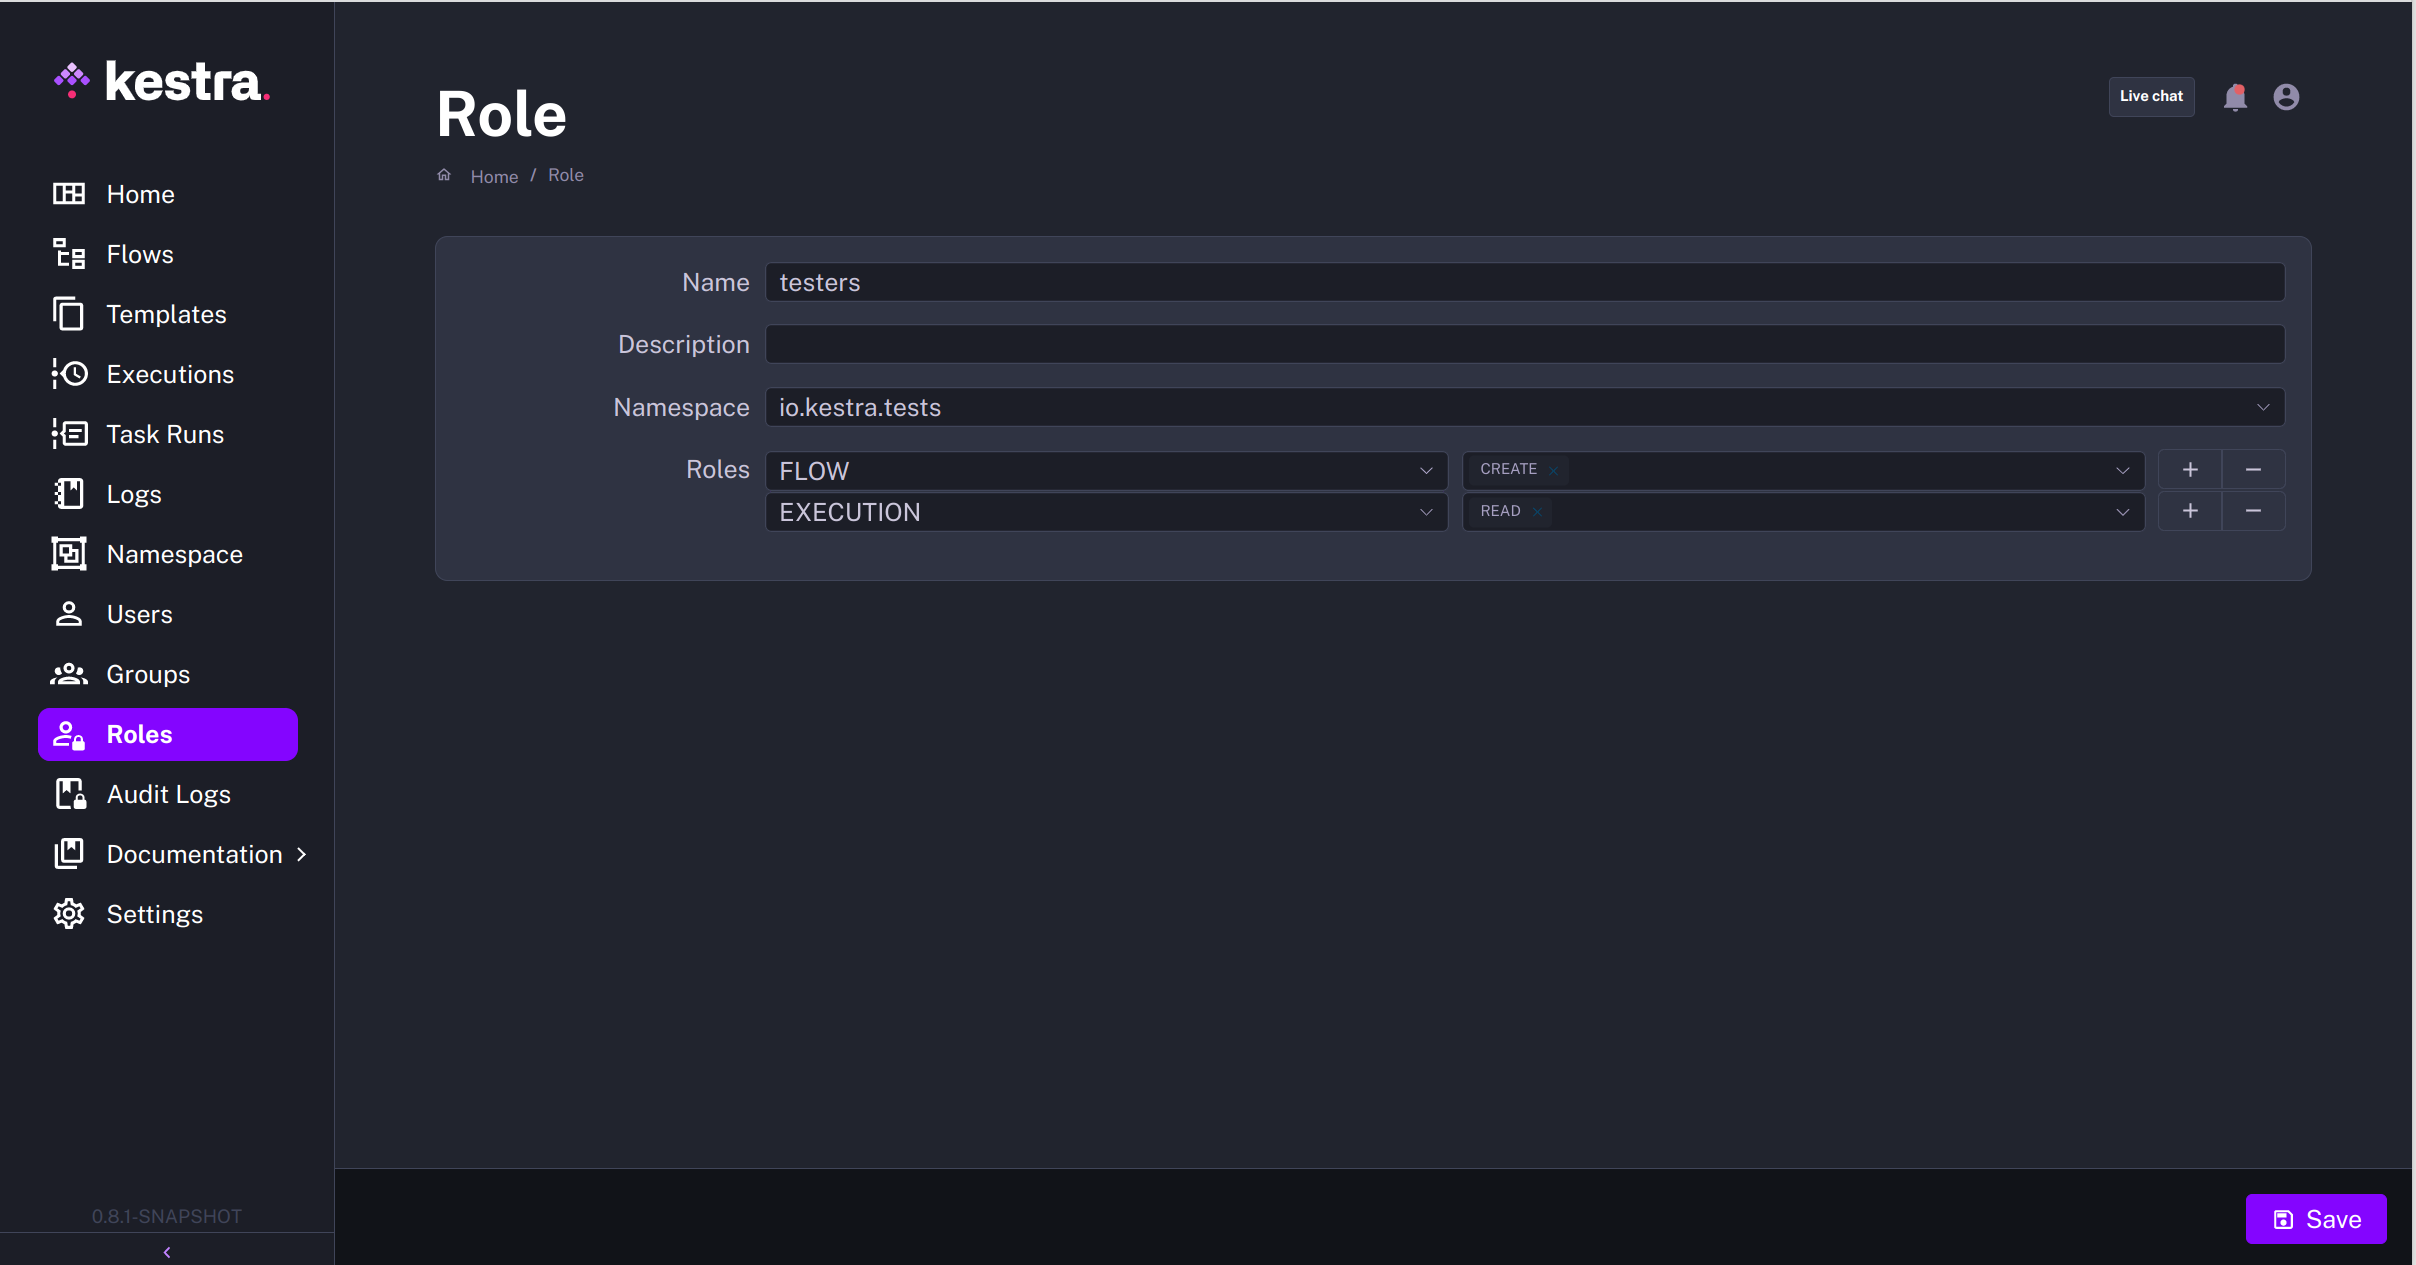
Roles manage CRUD (CREATE, READ, UPDATE, DELETE) access to Kestra resources such as flows, executions, or secrets. They can be attached to groups or users.
Audit Logs (EE)
This feature requires a commercial license.
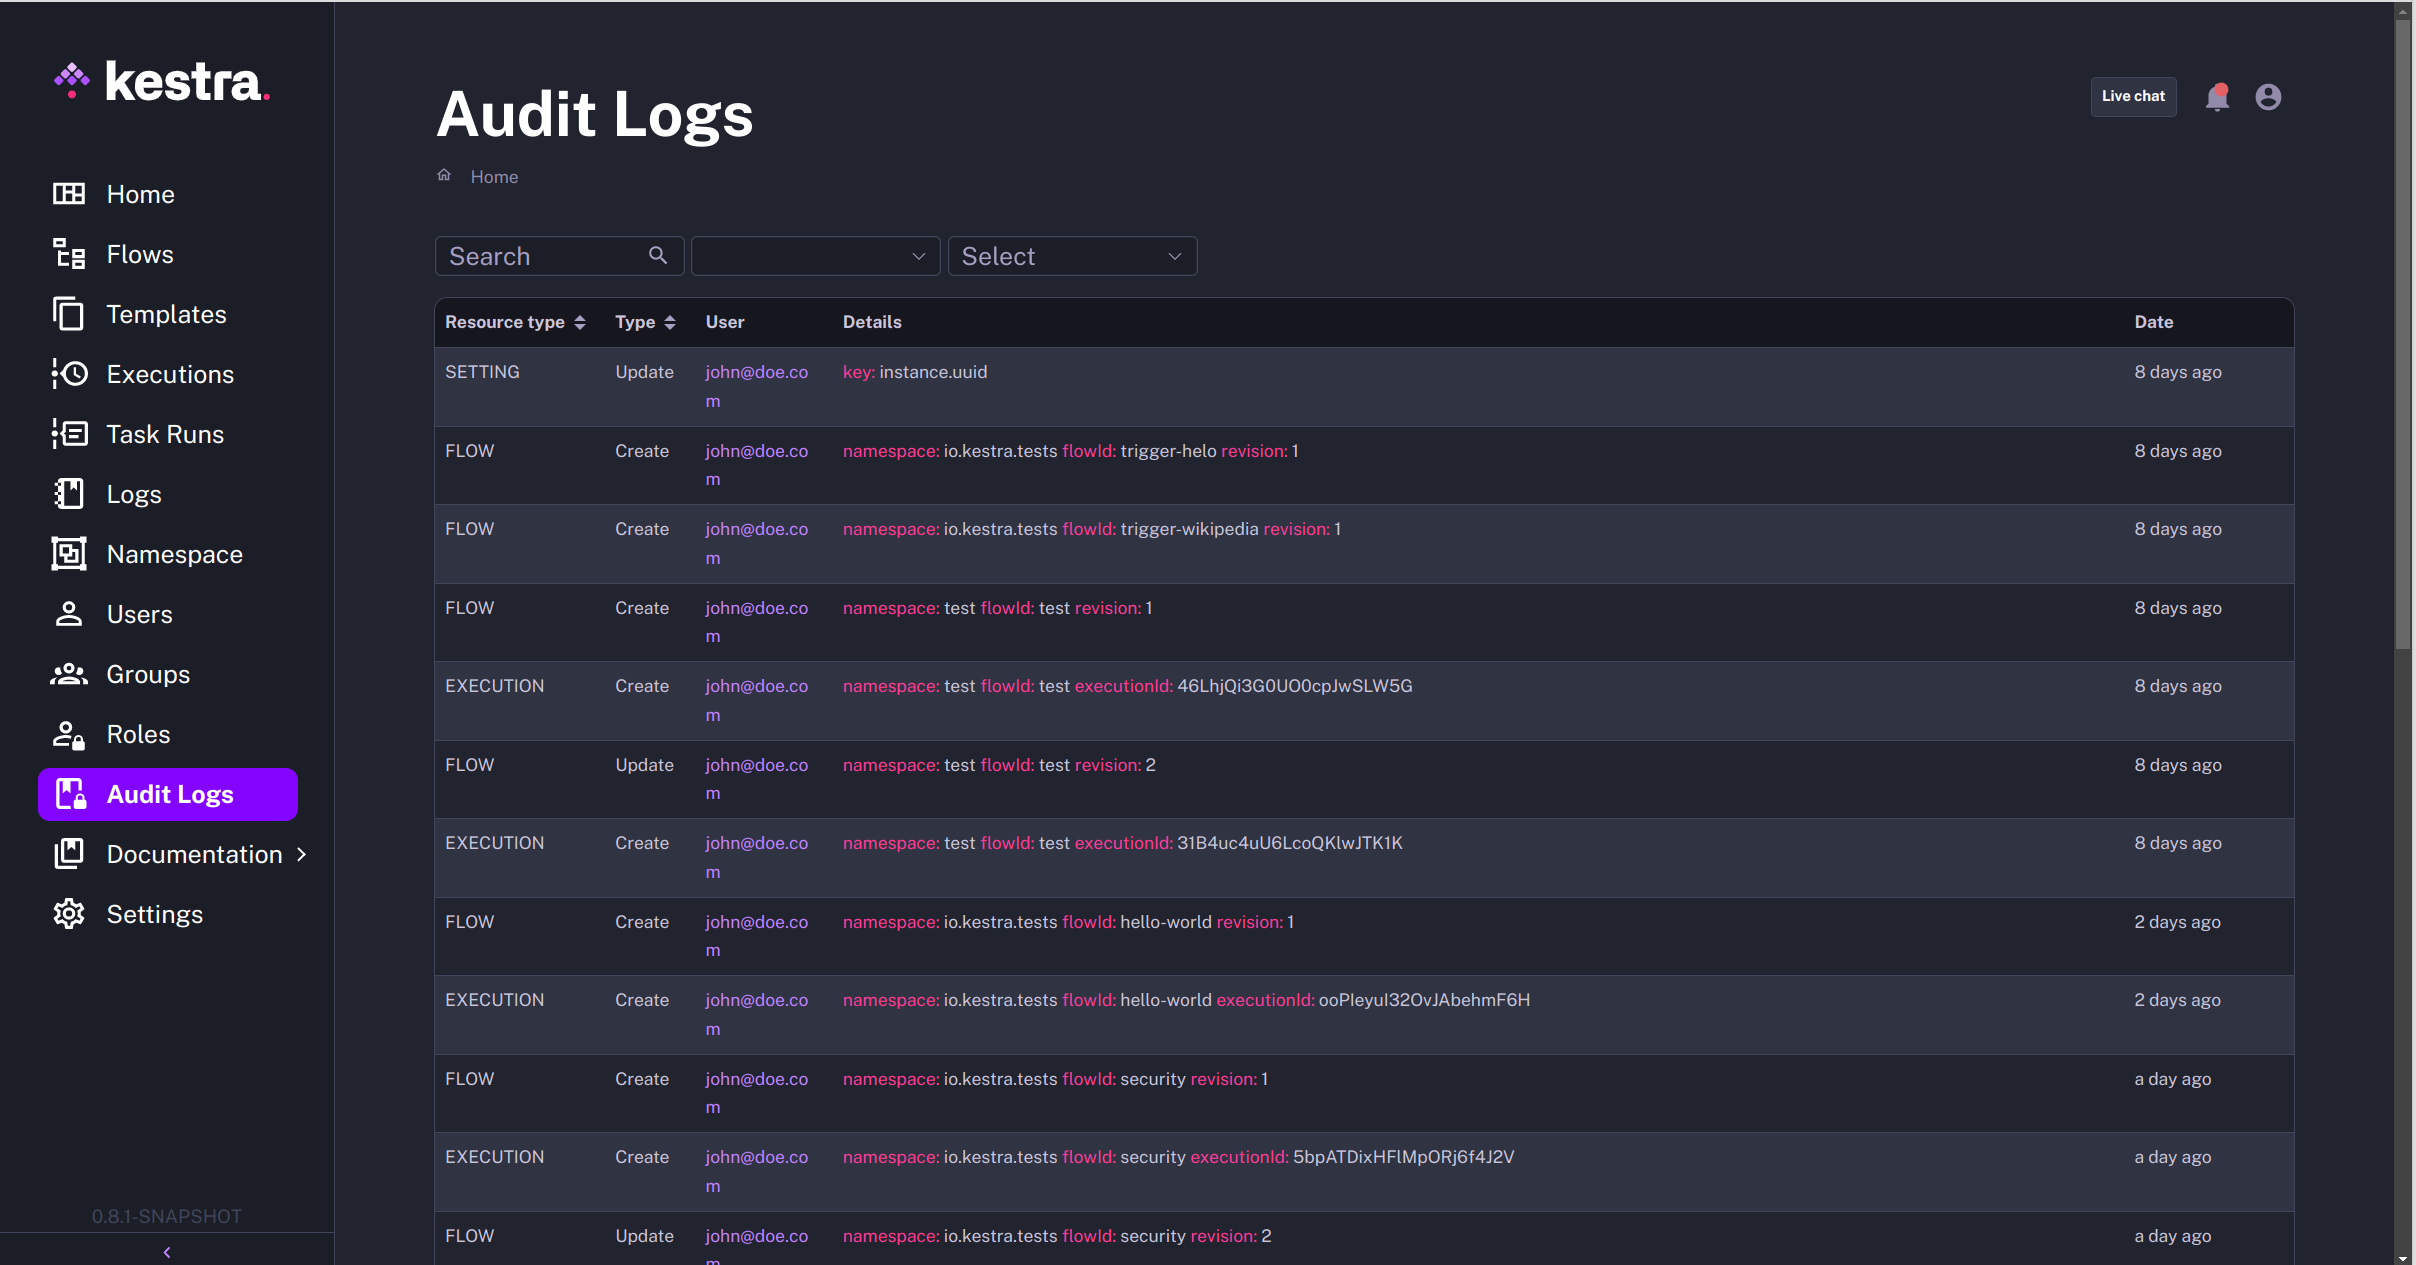
On the Audit Logs page, you will have access to all Kestra audit logs.
Audit logs record all activities made by all users on the resources created inside Kestra.
By reviewing audit logs, system administrators can track user activity, and security teams can investigate breaches and ensure compliance with regulatory requirements.
Blueprints
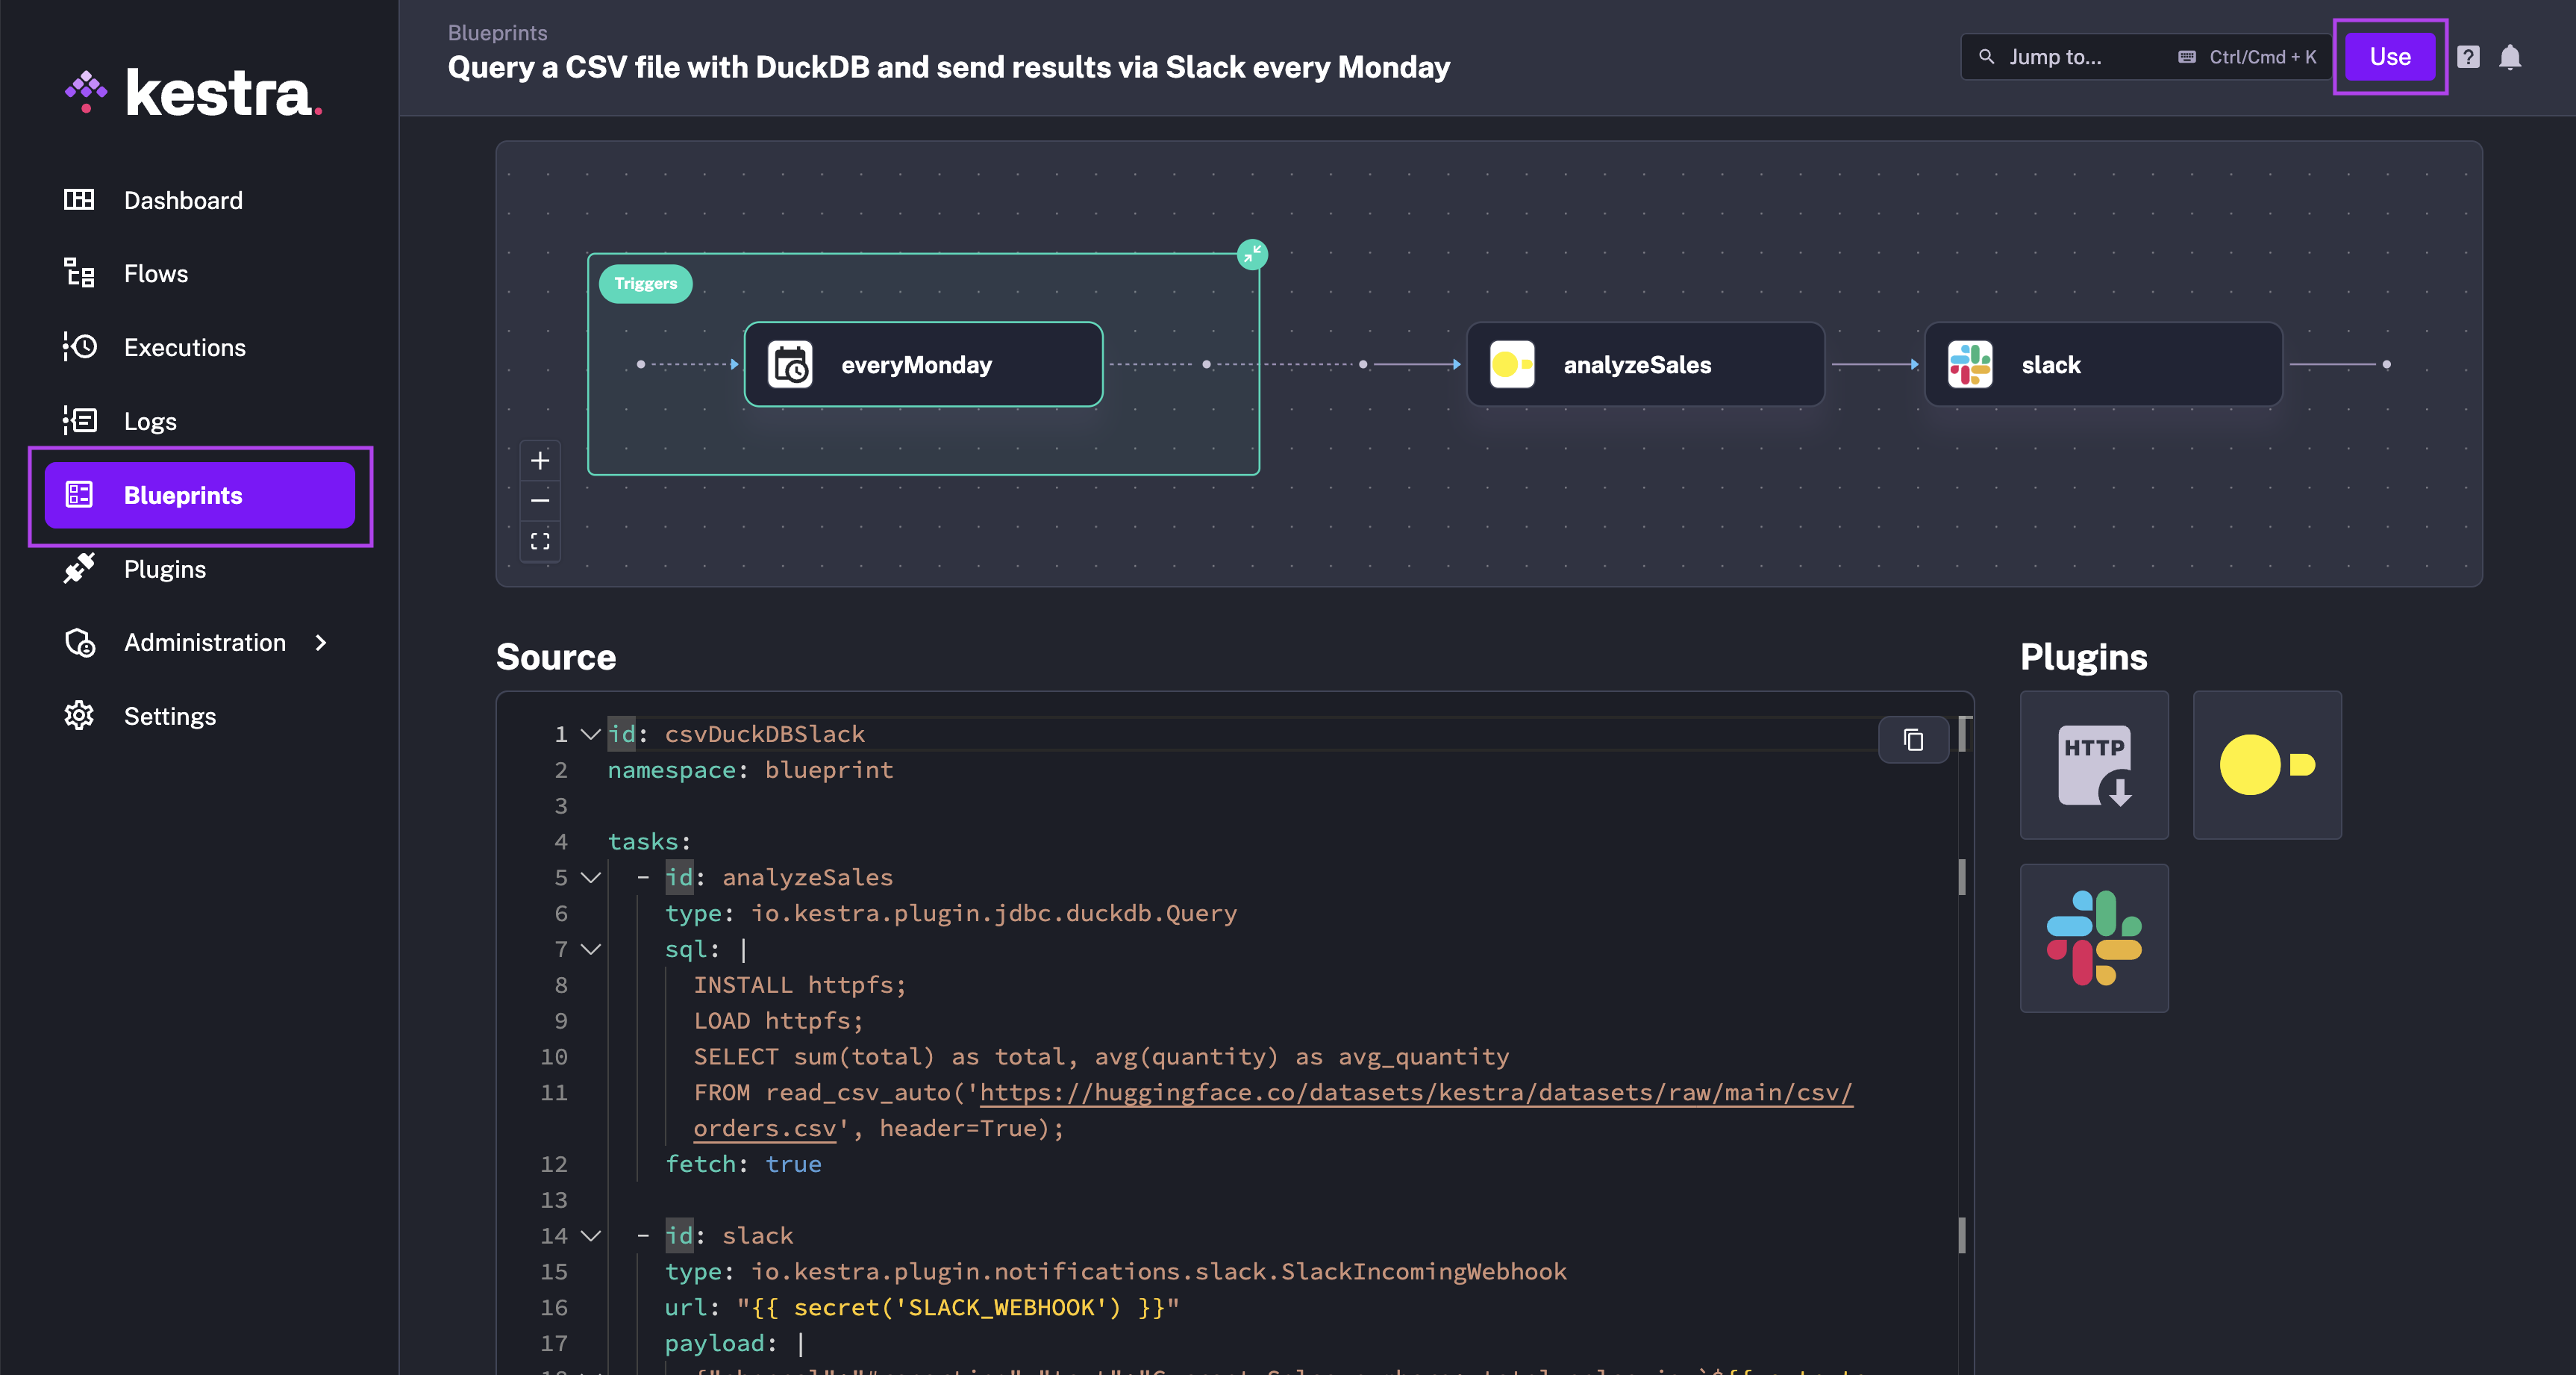
Blueprints are a curated, organized, and searchable catalog of ready-to-use examples designed to help you kickstart your workflow. Each Blueprint combines code and documentation, and can be assigned several tags for organization and discoverability.
All Blueprints are validated and documented. You can easily customize and integrate them into your new or existing flows with a single click on the "Use" button.
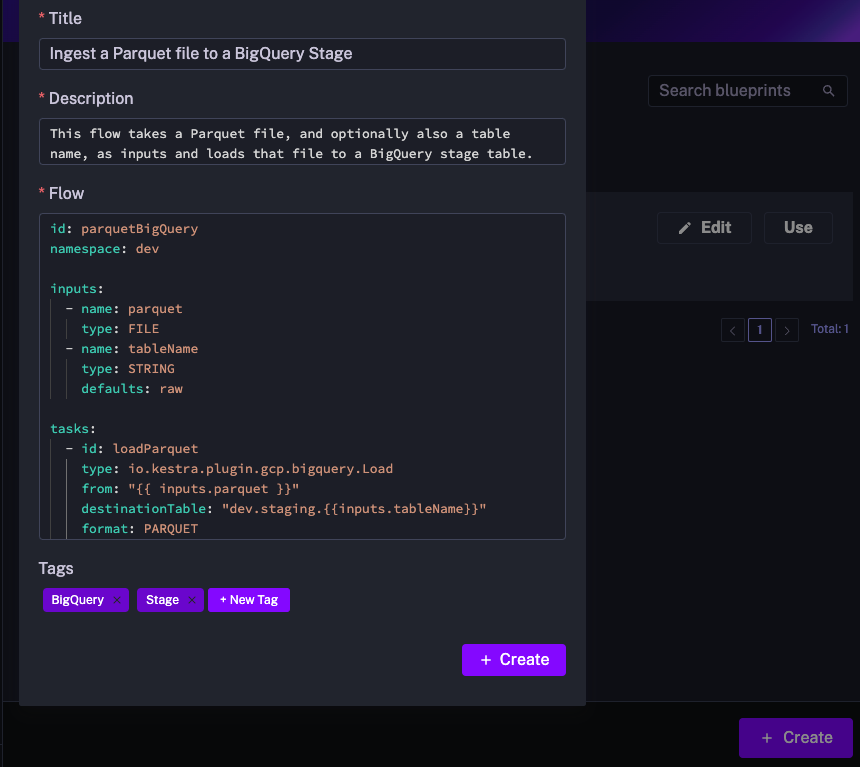
You can also create custom blueprints, shared within your organization.
Custom blueprints require a commercial license.
Check the Blueprints documentation for more details.
Was this page helpful?